. 2022 Feb 28;11:e74338. doi: 10.7554/eLife.74338

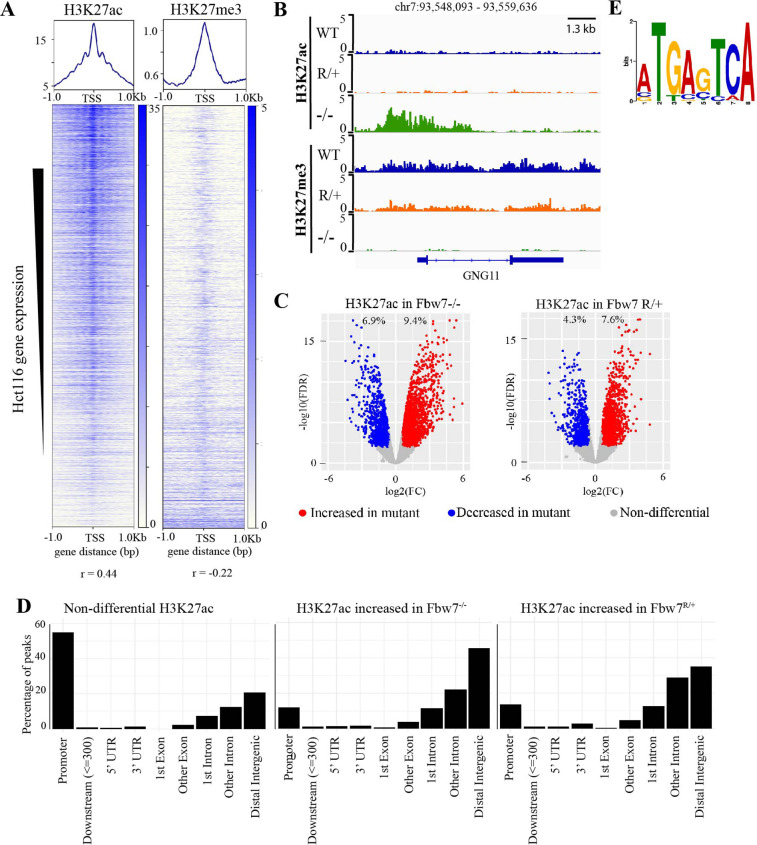
Figure 2. Differential H3K27ac signal in Hct116 Fbw7 mutant cells reveal genomic sites targeted by Fbw7.

(A) Heatmaps showing the correlation between CUT&RUN profiles of H3K27ac and H3K27me3, and RNA-Seq in Hct116 WT cells. (B) Genome browser view of H3K27ac and H3K27me3 signal from Hct116 WT, Fbw7R/+, and Fbw7−/− cells at a representative gene. (C) Peaks with increased (red) or decreased (blue) H3K27ac signal in Hct116 Fbw7−/− and Fbw7R/+ cells compared to WT cells. Differential sites indicated as a percent of total H3K27ac peaks in Hct116 WT cells. (D) Percentage of H3K27ac peaks located within different gene regions. (E) Sequence logo for AP-1 motif enriched in H3K27ac peaks increased in Fbw7−/− cells (E value=1.6e−3). See Figure 2—figure supplement 1, Figure 2—figure supplement 2, Figure 2—source data 1 and Figure 2—source data 2. Figure 2—figure supplement 3 has the complete MEME output and details on the FIMO analysis. CUT&RUN, cleavage under target and release using nuclease; WT, wild-type.

Figure 2—source data 1. H3K27ac differential sites.
This Excel file includes lists of peaks with increased and decreased H3K27ac signal in Hct116 Fbw7−/− and Fbw7R/+ relative to WT. Fold change and FDR listed for each peak. WT, wild-type.
elife-74338-fig2-data1.xlsx (517.7KB, xlsx)
Figure 2—source data 2. Summary of CUT&RUN differential sites.
This Excel file includes a summary (total number of differential sites, percentage, and number of annotated genes) of H3K27ac, Jun, and Myc differential sites in Hct116 cells and Jun differential sites in U5-NSCs. CUT&RUN, cleavage under target and release using nuclease; NSC, neural stem cell.

Figure 2.

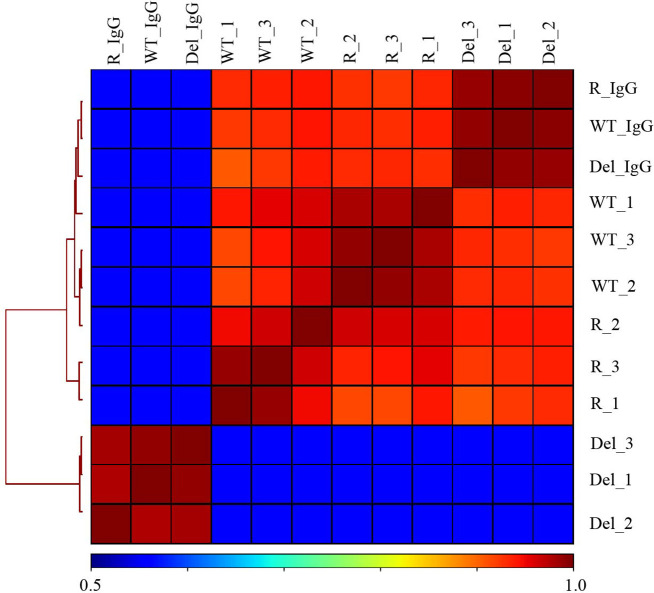
Figure 2—figure supplement 1. Hierarchically clustered correlation matrix of H3K27ac CUT&RUN profiles in Hct116 cells.

Figure 2—figure supplement 1.

Correlation matrix of three replicates from Hct116 WT, Fbw7−/− (Del), and Fbw7R/+ (R) cells. IgG negative control for each cell type included. Peaks from the three cell types were merged to create a final peak-set to perform the correlation analysis. CUT&RUN, cleavage under target and release using nuclease; WT, wild-type.
Figure 2—figure supplement 2. Percentage of peaks with decreased H3K27ac signal located within different gene features.
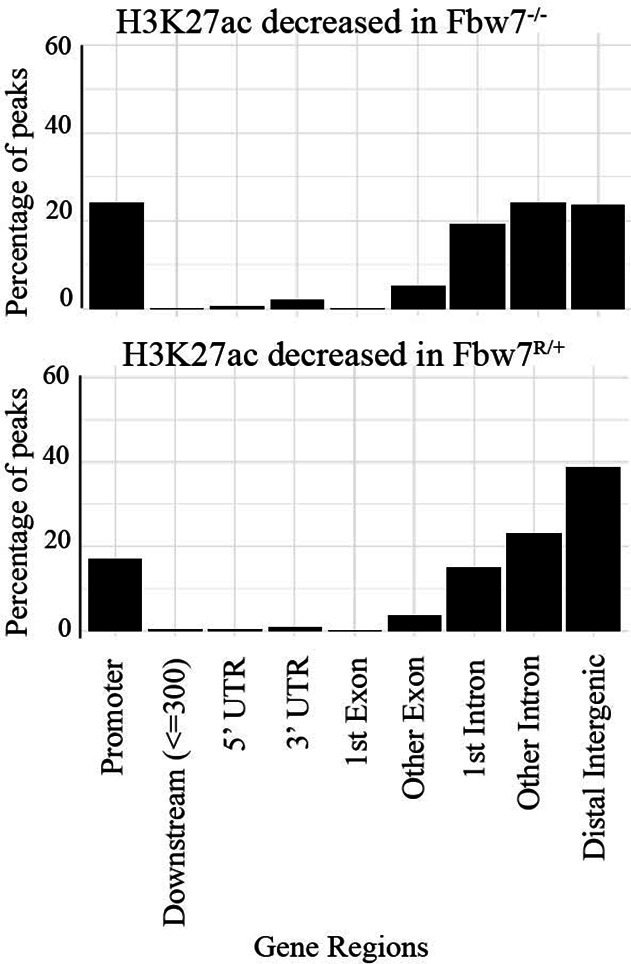
Figure 2—figure supplement 2.

Compared to nondifferential H3K27ac peaks, differential H3K27ac peaks enrich mostly within introns and intergenic regions (p<0.0001, Fisher test).
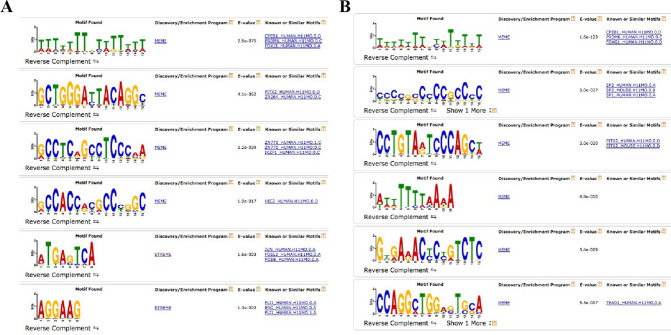
Figure 2—figure supplement 3. Complete output of the MEME-ChIP analysis on H3K27ac differential sites.

Figure 2—figure supplement 3.

(A) MEME-ChIP analysis on the sequences of H3K27ac increased sites in Fbw7−/− cells. (B) MEME-ChIP analysis on the sequences of nondifferential H3K27ac sites in Fbw7−/− cells (negative control, 1409 sites). *FIMO analysis revealed that AP-1 motif was enriched in approximately 30%–35% of H3K27ac sites that were decreased in Fbw7−/− (p<1.8e−5), increased in Fbw7R/+ (30.2%; p=1.8e−5), decreased in Fbw7R/+ (35%; p<1.5e−5); however, only 17% in nondifferential sites (1409 sites) (p<1.8e−5).