. 2022 Feb 28;11:e74338. doi: 10.7554/eLife.74338

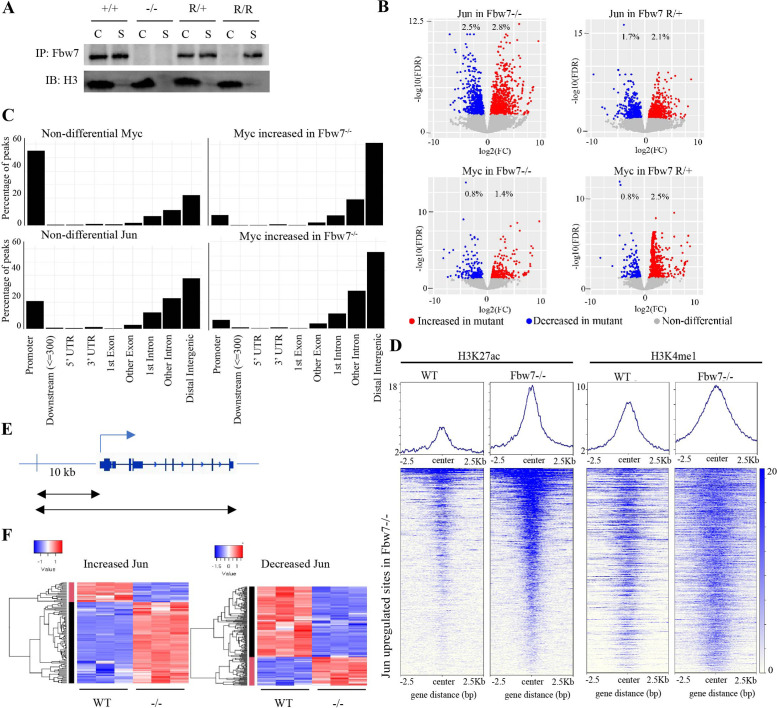
Figure 3. Fbw7 preferentially regulates Jun and Myc DNA occupancy at distal regulatory regions.

(A) Fbw7 abundance in chromatin (C) and soluble (S) fractions from Hct116 WT, Fbw7R/+, and Fbw7R/R cells. Histone H3 was detected in chromatin fractions. (B) Increased (red) and decreased (blue) Jun and Myc sites in Hct116 Fbw7−/− and Fbw7R/+ cells compared to WT. (C) Nondifferential and differential Jun and Myc peaks located within gene features. (D) H3K27ac and H3K4me1 CUT&RUN signal from Hct116 WT and Fbw7−/− cells mapped on genomic sites that have increased Jun occupancy in Fbw7−/− cells. (E) Schema depicting the filtering criteria applied to the annotated differential sites to select gene proximal sites. (F) Transcription of genes with increased or decreased Jun bound at a gene proximal site. (Each row is a gene and three replicates each from Hct116 WT and Fbw7−/− cells are shown. Replicates for each genotype were from a single clone, however from separately cultured samples.) See Figure 3—figure supplements 14 and Figure 3—source data 1–2. CUT&RUN, cleavage under target and release using nuclease; WT, wild-type.

Figure 3—source data 1. Original western blots for Figure 3A and Figure 3—figure supplement 1.
Figure 3—source data 2. Jun and Myc differential sites in Hct116 cells.
This Excel file includes lists of peaks with increased and decreased Jun and Myc signal in Hct116 Fbw7−/− and Fbw7R/+ relative to WT. Fold change and FDR listed for each peak. WT, wild-type.

Figure 3.

Figure 3—figure supplement 1. Fbw7 abundance in chromatin (C) and soluble (S) fractions from Hct116 WT, Fbw7R/+, and Fbw7R/R cells treated with and without Bortezomib.
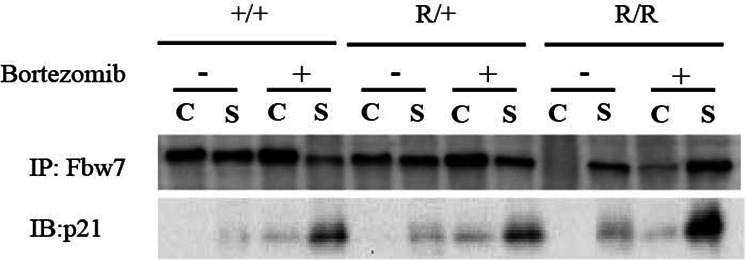
Figure 3—figure supplement 1.

WT, wild-type.
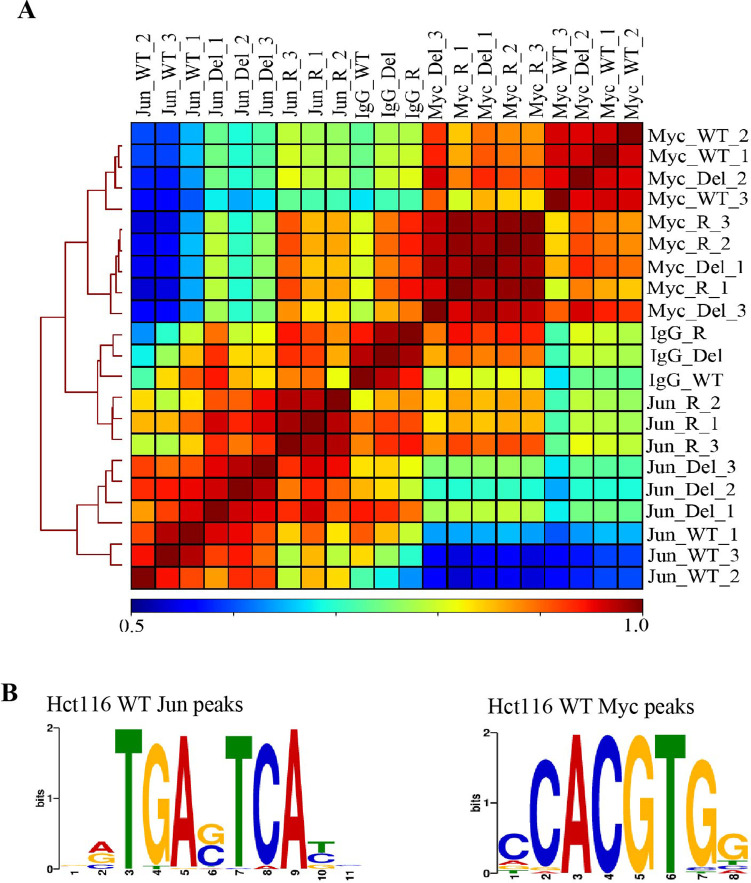
Figure 3—figure supplement 2. Validation of Jun and Myc CUT&RUN profiles.

Figure 3—figure supplement 2.

(A) Hierarchically clustered correlation matrix of Jun and Myc signal mapped in Hct116 WT, Fbw7−/− (Del), and Fbw7R/+ (R) cells. IgG negative control for each cell type included. Peaks from the three cell types were merged to create a final peak-set. (B) Sequence logo of the AP-1 motif enriched in the center 100-bp sequence of Jun peaks in Hct116 WT (E value=1.3e−53) and sequence logo of E-box motif enriched in the center 100-bp sequence of Myc peaks in Hct116 WT (1.7e−4). AP-1 motif was input to FIMO to scan for the motif in full sequence of 25,527 Jun peaks in Hct116 WT. FIMO output showed that motifs with score between 15.73 and 12.11 occurred 26,547 times (p<6.46e−05). E-box motif was input to FIMO to scan for the motif in full sequence of 24,111 Myc peaks in Hct116 WT. FIMO output showed that motifs with score between 15.32 and 9.24 occurred 9343 times (p<0.00024). Motif score range was determined by the exact similarity to TGAG/CTCA (AP-1 motif) or CACGTG (E box). CUT&RUN, cleavage under target and release using nuclease; WT, wild-type.
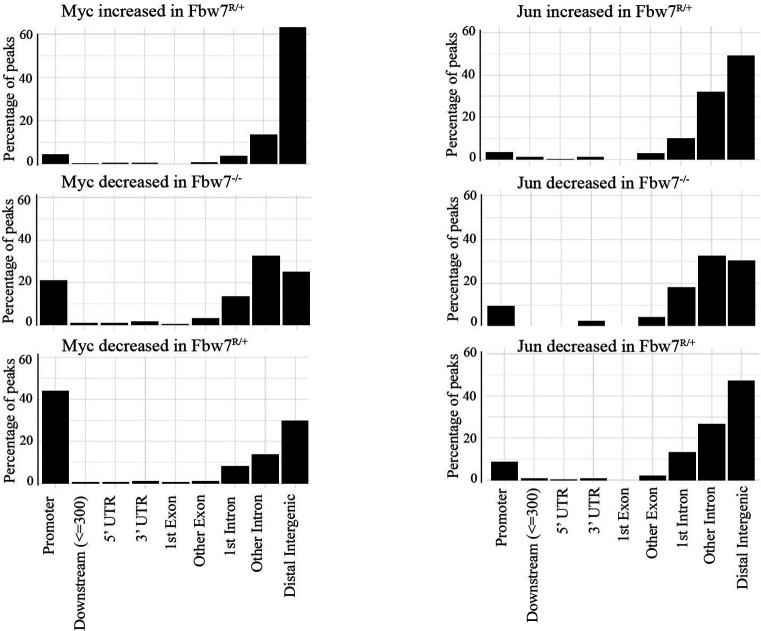
Figure 3—figure supplement 3. Percentage of Myc and Jun peaks located at different gene features.

Figure 3—figure supplement 3.

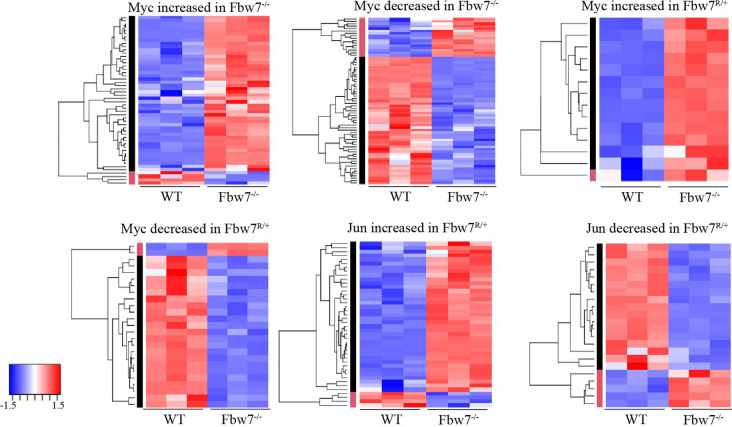
Figure 3—figure supplement 4. Transcription of genes with differential promoter-proximal Myc and Jun occupancy in Fbw7 mutant cells.

Figure 3—figure supplement 4.

Hierarchically clustered genes showing the transcription of genes that have increased or decreased Myc and Jun occupancy at gene proximal sites in Fbw7−/− and Fbw7R/+ cells.