
Figure 6. Transcriptional consequences of loss of Fbw7 in neural stem cells.
(A) Clustering analysis separates differentially expressed protein-coding genes in NSCs into two groups. Heatmap shows the intensity of expression of each gene (y-axis) for three replicates per cell type (x-axis). Three replicates were from two independently engineered cell samples. (B) TFs, pathways, and GO terms enriched in upregulated genes in Fbw7−/− NSCs. (C) Sites with increased (red) and decreased (blue) Jun in Fbw7−/− NSCs compared to WT. (D) Nondifferential and differential Jun peaks located within each gene feature. (E) Fold change of CIITA and MHC Class II genes in Fbw7−/− NSCs compared to WT. FDR values are given at the top of each bar. n=3. (F) Quantitative RT-PCR analysis of MHC Class II (HLA-DRA, HLA-DRB, HLA-DPA, and HLA-DPB) expression in Fbw7−/− NSCs. Mean fold change in Fbw7−/− cells with respect to WT cells. Error bars=SEM, n=3. (G) Genome browser view of Myc, Jun, and H3K27ac occupancy on CIITA regulatory regions in WT and Fbw7−/− NSCs. Black scale bar=8 kb. See Figure 6—figure supplements 1–3 and Figure 6—source data 1–4, Figure 6—figure supplement 1—source data 1, Figure 6—figure supplement 3—source data 1, Figure 6—figure supplement 5—source data 1. GO, gene ontology; TF, transcription factor; WT, wild-type.

Figure 6—figure supplement 1. Validation of U5-NSC Fbw7−/− generation and CUT&RUN Jun signal.

Figure 6—figure supplement 2. Proliferation of Fbw7 mutant U5 NSCs.

Figure 6—figure supplement 3. Percentage of peaks with decreased Jun in U5 NSC Fbw7−/− within different gene regions.
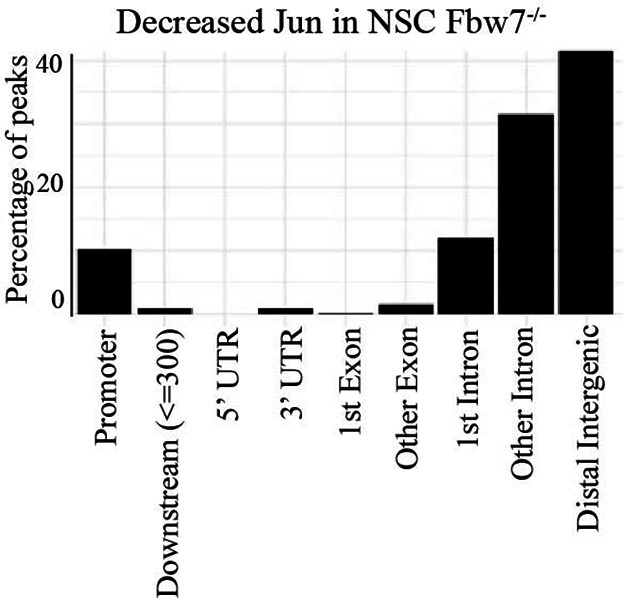
Figure 6—figure supplement 4. CIITA isoform III amplified using isoform specific primers in U5 NSCs.
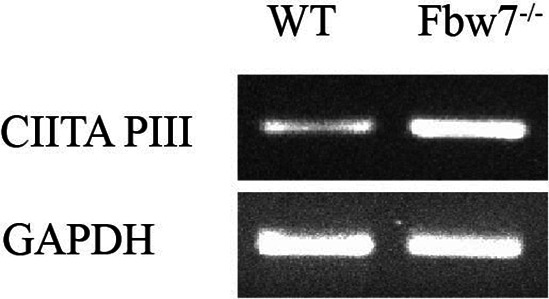
Figure 6—figure supplement 5. MHC Class II protein expression in Hct116 cells.

Figure 6—figure supplement 6. Comparison of differentially expressed (DE) genes in Hct116 and NSCs.
