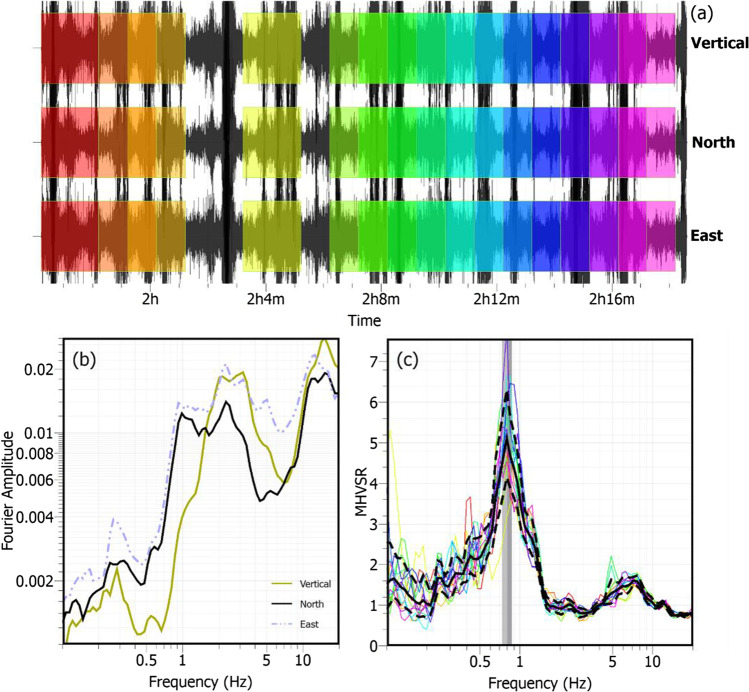
Fig. 1.
Illustrative example of the MHVSR method. a Windowing of microtremor time series. b Time window-averaged Fourier amplitude spectra (FAS) for each of the three components. c Average horizontal-to-vertical spectral ratio curve (solid black line with standard deviation shown by dashed lines) statistically calculated from each time window’s HVSR (colored lines). The peak frequency of the average HVSR curve and the standard deviation associated with the variability of the peak frequency values from the individual curves is indicated by the vertical gray shading. This example in Metro Vancouver, British Columbia, Canada, is calculated using the Geopsy software package (Wathelet et al. 2020)

