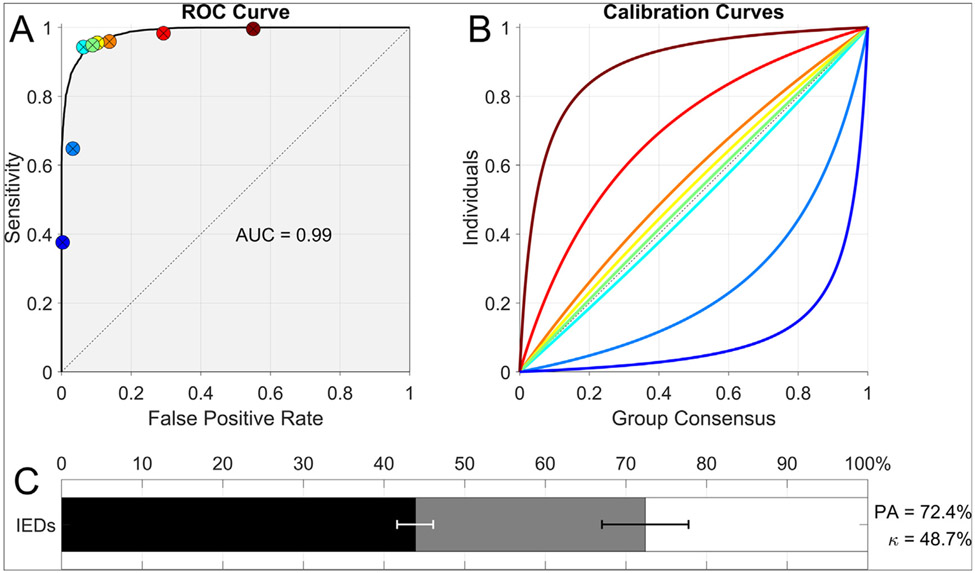
Fig. 1.
A: Receiver operating characteristic curve fit to all experts’ scores, with the operating point (false-positive rate = 1 – specificity and sensitivity) of each expert indicated by a solid circle. B: Parametric calibration curve fit to the binary scores of each export, indicating the probability of that expert marking events within a given bin as IEDs. These curves allow assessment of the variation among experts relative to the group consensus. Colors are ordered from maximal under calling (blue) to maximal over calling (red). C: Inter-rater reliability (IRR): Kappa (κ) values in relation to percent agreement. Horizontal bars show the percent agreement (PA, black + gray bars, 95% CI in black error bar), relative to the maximal possible (100%, end of white bar). The length of the black bar shows the percent agreement by chance, PC (95% CI in white error bar). Mathematically, the chance-corrected IRR, κ, is the percentage of this possible beyond-chance agreement that is actually achieved, that is, κ = (PA − PC)/(100 − PC). Graphically, κ is represented as the fraction of the distance between 100% and the end of the black bar that is taken up by the gray bar.

