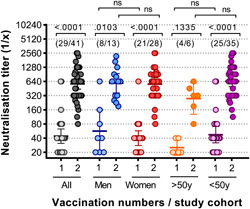
Figure 4.

Peak virus neutralisation titres of naïve individuals after first and after second vaccination are independent of gender and age. Virus neutralisation titres are shown after the first 1 and the second 2 vaccination for all naïve individuals and represented also according to gender (men/women) and age (>50 years or <50 years). The numbers in bracket in the upper part of the graph indicate in each group the number of persons that donated blood after the first and after the second dose. Statistical analysis was performed using Kruskal–Wallis test (nonparametric one‐way ANOVA) with Dunn's multiple comparison test. All p values lower than .05 were considered statistically significant and p values >.0001 were indicated as exact numbers. ANOVA, analysis of variance [Color figure can be viewed at wileyonlinelibrary.com]
