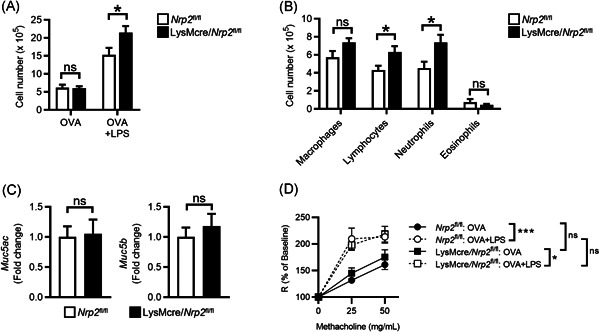
Figure 3.

LysMcre/Nrp2 fl/fl mice have enhanced airway inflammation in a neutrophilic asthma model. (A) Total BALF cell counts in Nrp2 fl/fl (white bars) or LysMcre/Nrp2 fl/fl mice (black bars) sensitized with either OVA or OVA + LPS and then challenged with OVA as in Figure 2A. Bars represent mean ± SEM (n = 4–6 mice for OVA only groups; n = 14–16 for OVA + LPS groups). *p < .05, ***p < .001, Student's t‐test. (B, C) BALF cell differential counts (B) and lung mucin gene expression (C) from OVA‐challenged Nrp2 fl/fl or LysMcre/Nrp2 fl/fl mice sensitized with OVA + LPS. Bars represent mean ± SEM (n = 14–16 mice per group). (D) Airway resistance (R) following methacholine challenge of mice treated as indicated. Symbols represent mean ± SEM (n = 5 mice for OVA only groups; n = 8 for OVA + LPS groups). *p < .05, ***p < .001, two‐way ANOVA with Tukey multiple comparison tests. ANOVA, analysis of variance; BALF, bronchoalveolar lavage fluid; LPS, lipopolysaccharide; NRP2, neuropilin‐2; ns, not significant; OVA, ovalbumin
