
Figure 6.
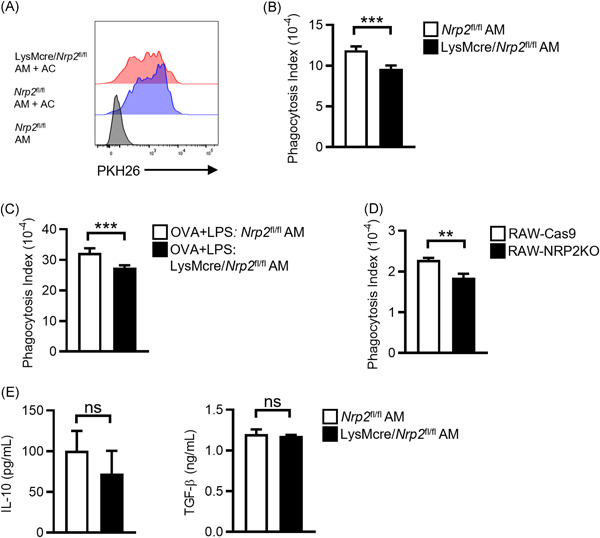
Efferocytosis is impaired in NRP2‐deficient AM. (A, B) AM from Nrp2fl/fl or LysMcre/Nrp2fl/fl mice were cultured with PKH26‐labeled apoptotic Jurkat cells at a ratio of 5:1 apoptotic cells:AM. Two hours later, AM was washed and efferocytosis of apoptotic cells (AC) was determined by flow cytometry. (A) Representative cytograms showing efferocytosis of PKH26‐labeled apoptotic cells by AM from Nrp2 fl/fl mice (blue histogram) or LysMcre/Nrp2 fl/fl mice (red histogram). AM cultured without apoptotic cells (gray histogram) were included as a negative control for gating. (B) Phagocytosis index for Nrp2fl/fl or LysMcre/Nrp2fl/fl AM. Bars represent mean ± SEM ( = 5 mice per group). (C) AM was isolated from Nrp2fl/fl or LysMcre/Nrp2fl/fl mice that had been sensitized with OVA + LPS and challenged with OVA as in Figure 2A. Efferocytosis of apoptotic Jurkat cells was determined as in (A). Bars represent mean ± SEM (n = 5 mice per group). (D) Phagocytosis index for NRP2‐deficient (RAW‐NRP2KO) and control (RAW‐Cas9) RAW 264.7 macrophages. Bars represent mean ± SEM of triplicate wells. Representative data from one of two independent experiments is shown. (E) AM from Nrp2fl/fl or LysMcre/Nrp2fl /fl mice were cultured with apoptotic cells at a ratio of 5:1 apoptotic cells:AM for 24 h. Levels of IL‐10 and TGF‐β in cell culture supernatants were measured by ELISA. **p < .01, ***p < .001, Student's t‐test. AM, alveolar macrophages; ELISA, enzyme‐linked immunosorbent assay; IL‐10, interleukin‐10; LPS, lipopolysaccharide; NRP2, neuropilin‐2; ns, not significant; OVA, ovalbumin; TGF‐β, transforming growth factor‐β