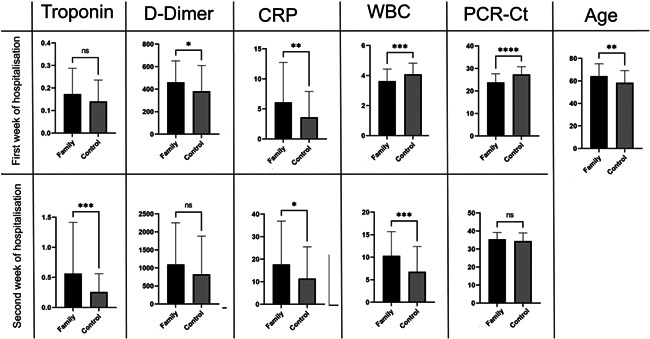
Figure 7.

The differences between families with >1 death and control group in some parameter value in the first and the second week of COVID‐19 disease first and second week of the COVID‐19 disease. CRP, C‐reactive protein; PCR‐Ct, polymerase chain reaction–cycle threshold; WBC, white blood cell. NS, 0.1234; *0.0332; **0.0021; ***0.0002; ****<0.0001.
