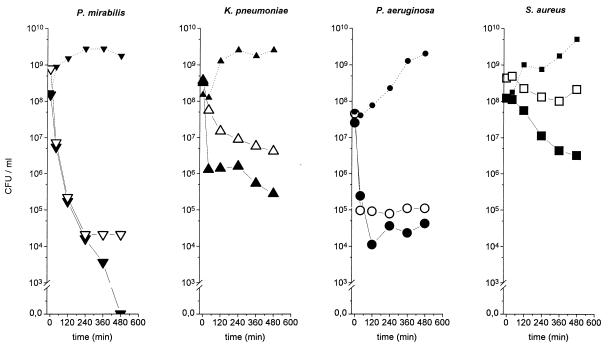
FIG. 2.
Mean time-kill curves for the in vitro simulation model, in which the in vivo time course of ciprofloxacin concentration, obtained by measuring antibiotic concentrations in serum and the interstitial space fluid in the experiments shown in Fig. 1, was simulated in vitro for Proteus mirabilis, Klebsiella pneumoniae, Pseudomonas aeruginosa, and Staphylococcus aureus. Solid symbols indicate time-kill data for serum drug concentrations; open symbols indicate time-kill data for interstitial subcutaneous concentrations; the dotted lines (small solid symbols) are the growth control curves.

