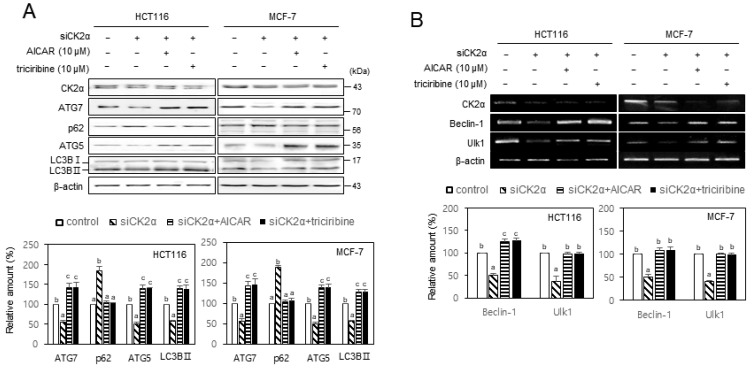
Fig. 4. CK2 positively regulated autophagy via AMPK and AKT pathways in human cancer cells.
HCT116 and MCF-7 cells were transfected with CK2α siRNA for 2 days in the absence or presence of 10 μM AICAR or 10 μM triciribine. (A) The level of each protein was determined by immunoblotting using specific antibodies (top). (B) The level of each mRNA was determined by RT-PCR using specific primers (top). Representative data from three independent experiments are shown. β-Actin was used as a control. The graphs represent the quantitation of each protein and mRNA relative to β-actin (bottom). Data are reported as mean ± SEM. Bars that do not have the same letter (a, b, c) were significantly different among groups at P < 0.05.

