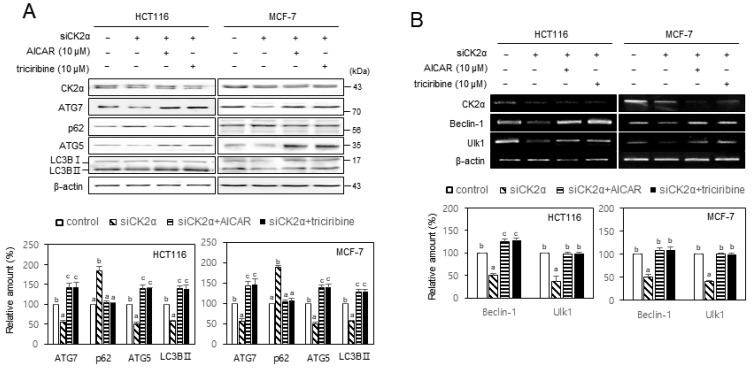
Fig. 5. Overexpression of FoxO3a rescued CK2 downregulation-mediated autophagy inhibition in human cancer cells.
HCT116 and MCF-7 cells were transfected with CK2α siRNA for 2 days in the absence or presence of pECE-HA-FoxO3a. (A) The level of each protein was determined by immunoblotting using specific antibodies (top). (B) The level of each mRNA was determined by RT-PCR using specific primers (top). Representative data from three independent experiments are shown. β-Actin was used as a control. The graphs represent the quantitation of each protein and mRNA relative to β-actin (bottom). Data are reported as mean ± SEM. Bars that do not have the same letter (a, b, c) were significantly different among groups at P < 0.05.

