Fig. 1.
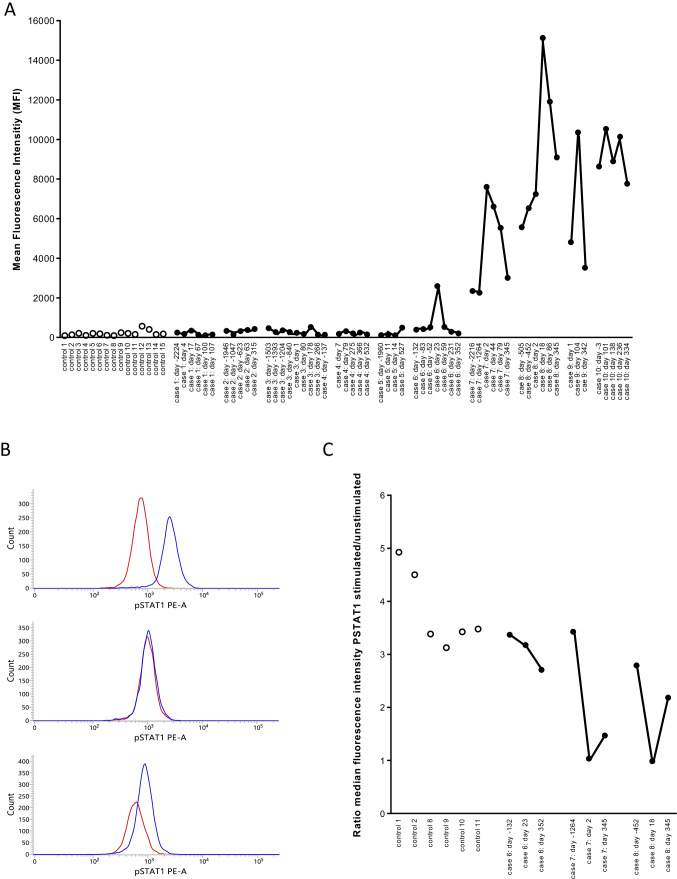
Antibodies to IFN-α2 in controls and in COVID-19 patients. Panel A. Antibodies to IFN-α2 were measured in 15 healthy controls, in 6 patients with pre-COVID-19 antibody levels that were comparable to the antibody levels in the 15 controls (cases 1–6), in 2 patients with pre-COVID anti-IFN-α2 antibodies (cases 7–8) and in 2 patients with anti-IFN-α2 antibodies but for whom with no pre-COVID samples were available (cases 9–10). In COVID-19 patients, antibody levels were measured in pre-COVID-19 samples, during and post-COVID-19. The results are from a representative experiment out of 2 experiments. Controls are represented by open symbols, cases by filled symbols. In the X-axis, the number of days before infection or the number of days post-infection are indicated (first positive PCR for SARS-CoV-2 is day 0). Panel B. STAT-1 phosphorylation in the presence of 10% serum in unstimulated (red line) or stimulated (10 ng/mL IFN-α2) cells (blue line). The distribution of the fluorescence intensities is shown. The results for patient case 7 are shown with serum obtained before (day − 1264), during (day 2) and after (day 345) SARS-CoV-2 infection. Panel C. Neutralizing capacity of 10% serum on whole blood STAT-1 phosphorylation. STAT-1 phosphorylation was evaluated in 6 controls and three patients (cases 6, 7, and 8). For each patient, three serum samples (pre-infection, during infection, and post-infection) were evaluated. The ratio of the median fluorescence intensity in IFN-α2-stimulated to unstimulated cells was calculated. A ratio of 1 indicates that IFN-α2-induced STAT1 phosphorylation was abolished, suggesting the presence of neutralizing antibodies. The days before or after the first positive PCR for SARS-CoV-2 are indicated (first positive PCR is day 0)

