FIGURE 1.

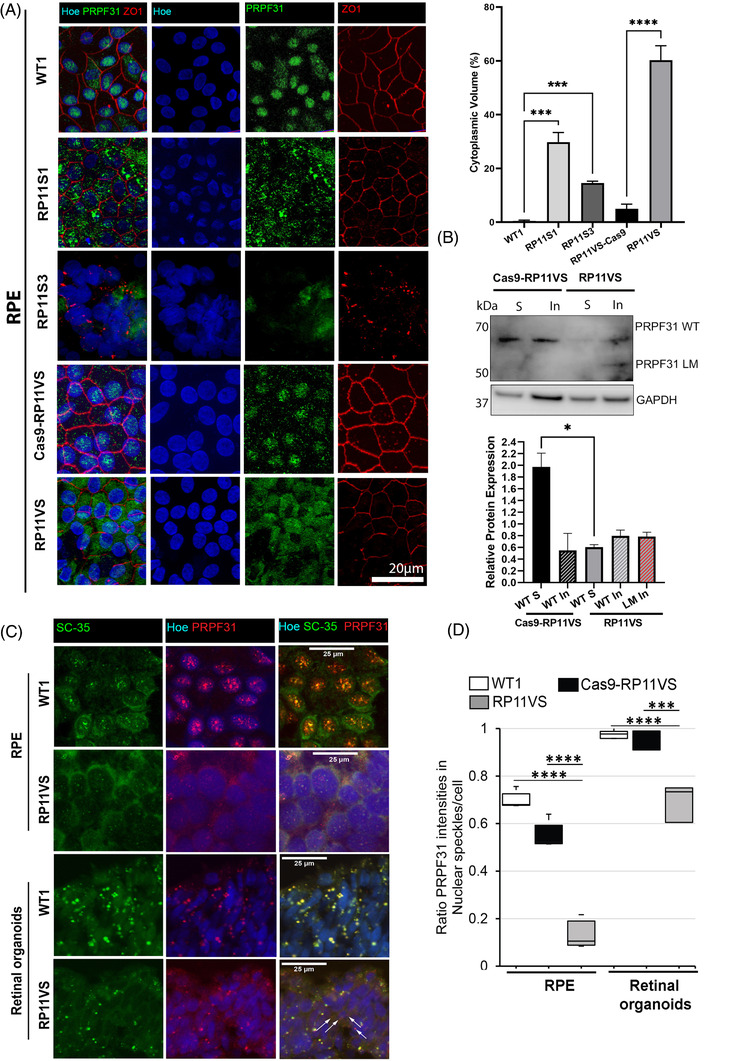
Cytoplasmic localisation of PRPF31 in patient RP11‐RPE cells, altered morphology of nuclear speckles and reduced localisation of nuclear PRPF31 in splicing speckles of RP11‐RPE and retinal photoreceptors. (A) Control and RP11‐RPE cells were immunostained with an anti‐PRPF31 N terminus (green) and ZO1 (red) antibody. Cell nuclei were stained with Hoechst. Immunofluorescence analysis showed localisation of PRPF31 protein mainly in the nucleus of control RPE cells in speckle‐like structures, whereas in RP11‐RPE cells, PRPF31 protein was predominantly located in the cytoplasm in an aggregate‐ like pattern. Scale bars: 20 μm. Quantification of cytoplasmic PRPF31 volume showed a significant increase in the percentage of cytoplasmic PRPF31 in RP11‐RPE compared to control cells. Data represent the mean ± SEM (n = 3). Statistical significance was assessed using one‐way ANOVA. ***P < 0.001 ****P < 0.0001. (B) Representative Western blot and quantification analysis showing the expression of wild type (WT) and long mutant (LM) PRPF31 protein in the soluble and insoluble fractions of isogenic control and RP11‐RPE cells. The PRPF31 N terminal antibody was used. GAPDH was used as a loading control. Data represent the mean ± SEM (n = 3). Statistical significance was assessed using one‐way ANOVA. *P < 0.05. (C) Co‐staining of RPE and retinal organoids with SC35 (SRSF2), a marker for nuclear speckles, and PRPF31 showing altered morphology of nuclear speckles and localisation of PRPF31 in RP11VS RPE and photoreceptor cells. Cell nuclei were counterstained with Hoechst. Arrows indicate accumulation of mislocalised PRPF31 in the cytoplasm of retinal photoreceptors. Scale bars: 25 μm. Representative images of control and RP11VS from three independent experiments are shown. (D) Quantification of signal intensities showing that PRPF31 mislocalisation is more prominent in RP11‐RPE cells. A total of 200–300 cells per experiment and three independent experiments were measured and plotted. The significance was analysed by t‐test; ***P < 0.001, ****P < 0.0001.
