FIGURE 5.

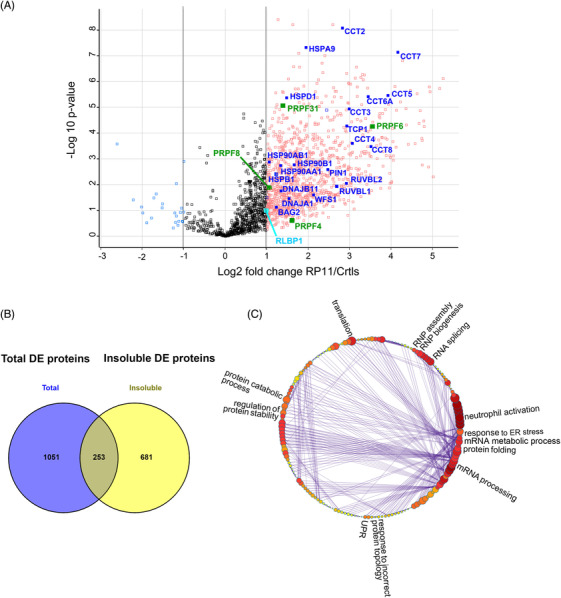
Differential protein abundance in the insoluble fractions of RP11‐RPE cells. (A) Volcano plot indicating the DE proteins in the insoluble fractions of RP11‐RPE cells highlighting unfolded protein response (blue), visual perception (cyan) and tri‐snRNP related (green) proteins. (B) Venn diagram showing overlapping proteins between DE proteins detected from total cell extract (purple) and insoluble fractions (yellow) of RP11‐RPE cells. (C) Cluster illustrating the affected pathways of enriched GOBP insoluble proteins including RNA splicing, mRNA processing, mRNA metabolic process, protein folding, UPR, regulation of protein stability, protein catabolic process, translation and RNP assembly and biogenesis. A Log2 fold change cut‐off 1 was applied for the identification of significantly regulated proteins between insoluble fractions of control and RP11‐RPE cells shown in Table S4.
