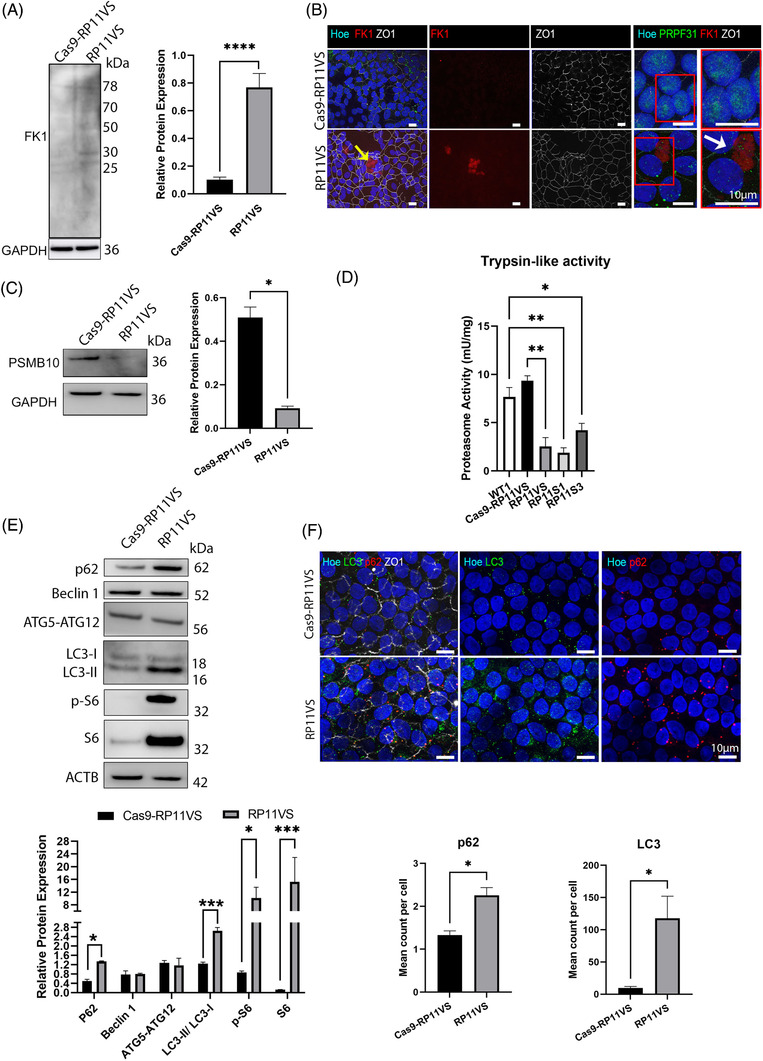
FIGURE 6.

Accumulation of ubiquitin‐conjugated proteins and dysfunction of the waste disposal mechanisms in RP11‐RPE cells. (A) Representative Western blot and quantification analysis of all detected FK1‐positive bands (ubiquitin‐conjugated proteins) in RP11VS RPE cells compared to isogenic control RPE cells. GAPDH was used as a loading control. Data represent the mean ± SEM (n = 3). Statistical significance was assessed using unpaired Student t‐test. ****P < 0.0001. (B) Immunostaining of RP11VS‐RPE and isogenic control RPE cells with FK1 (red) and ZO1 (white) showing accumulation of FK1 in RP11VS‐RPE cells in the form of aggregates (shown by yellow arrow) but not in control cells. Magnified images show association of FK1 with PRPF31 (shown by white arrow). Cell nuclei were counterstained with Hoechst. Representative images from three independent experiments in RPE cells at week 12 of differentiation are shown. Scale bars: 10 μm. Data obtained from RPE cells at week 12 of differentiation. (C) Representative Western blot and quantification analysis of RPE samples showing downregulation of PSMB10 protein in RP11VS RPE cells compared to isogenic control. GAPDH was used as a loading control. Data represent the mean ± SEM (n = 3). Statistical significance was assessed using. *P < 0.05. (D) Reduced Proteasome Trypsin‐like activity in RP11‐RPE compared to control RPE cells. Statistically significant differences are determined by one‐way ANOVA (*P < 0.05, **P < 0.001). Data are presented as mean ± SD, n = 3. (E) Representative Western blot and quantification analysis of key autophagic components showing upregulation of p62, LC3‐I, LC3‐II, p‐S6 and S6 expression in RP11‐RPE cells compared to isogenic control RPE cells. Actin B was used as a loading control. Data represent the mean ± SEM (n = 3). Statistical significance was assessed using two‐way ANOVA. *P < 0.05, ***P < 0.001. (F) Quantitative immunofluorescence analysis showed upregulation of p62 (red) and LC3 (green) in RP11VScompared to isogenic control RPE cells. ZO1 (white) was used to define the tight junctions of RPE cells. Cell nuclei were counterstained with Hoechst. Scale bars: 10 μm. Statistically significant differences are indicated by paired Student t‐test,*P < 0.01. Data are presented as mean ± SEM, n = 5.
