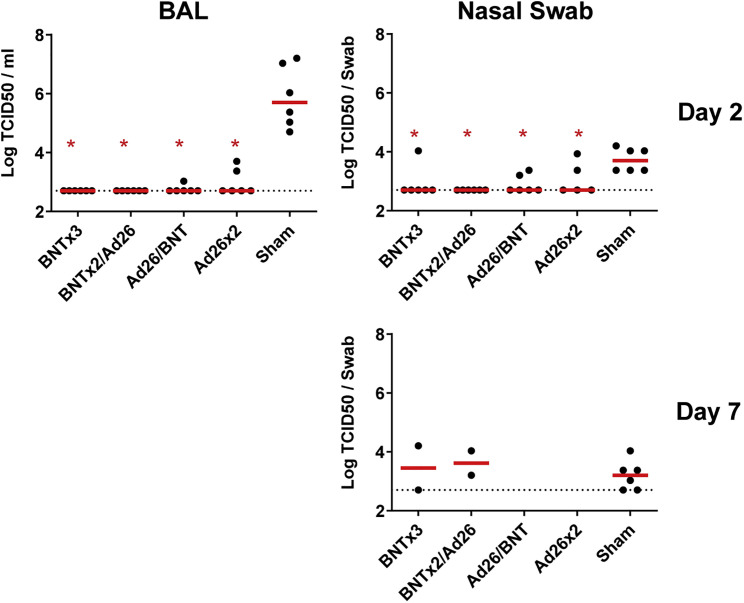
Figure S3.
TCID50 titers, related to Figure 3
Log TCID50/mL in bronchoalveolar lavage (BAL) and nasal swabs on day 2 following SARS-CoV-2 Omicron challenge (top). Log TCID50/mL is also shown in nasal swabs on day 7 following SARS-CoV-2 Omicron challenge in the 4 vaccinated animals in the BNTx3 and BNTx2/Ad26 groups and in the 6 sham controls with persistently positive sgRNA levels on day 7 (bottom). Dotted lines represent limits of quantitation. Medians (red bars) are shown. Vaccinated groups were compared with the sham controls by two-sided Mann-Whitney tests. ∗p < 0.05.

