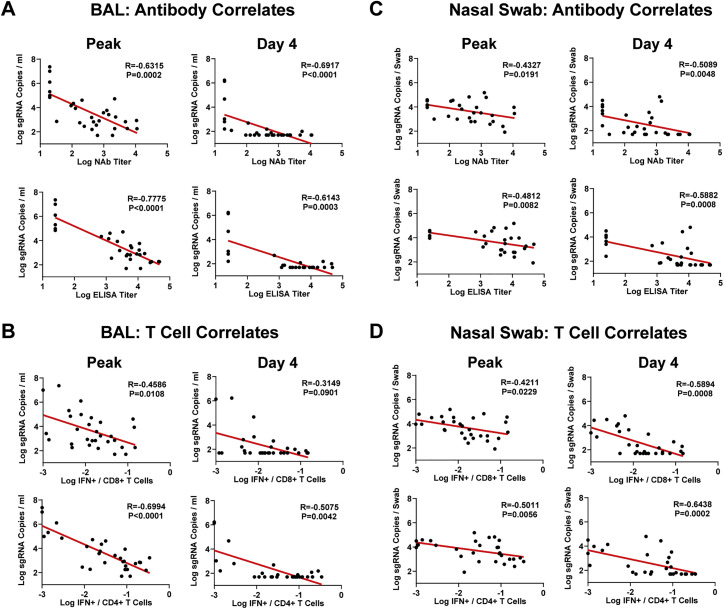
Figure S5.
Correlates of protection, related to Figure 5
(A and B) Correlations of week 18 NAb and ELISA titers (A) and week 16 CD8+ and CD4+ T cell responses (B) with peak and day 4 sgRNA copies/mL in BAL are shown.
(C and D) Correlations of week 18 NAb and ELISA titers (C) and week 16 CD8+ and CD4+ T cell responses (D) with peak and day 4 sgRNA copies/swab in NS are also shown. Correlations were assessed by two-sided Spearman rank-correlation tests. R and p values and a regression line of best fit are shown.

