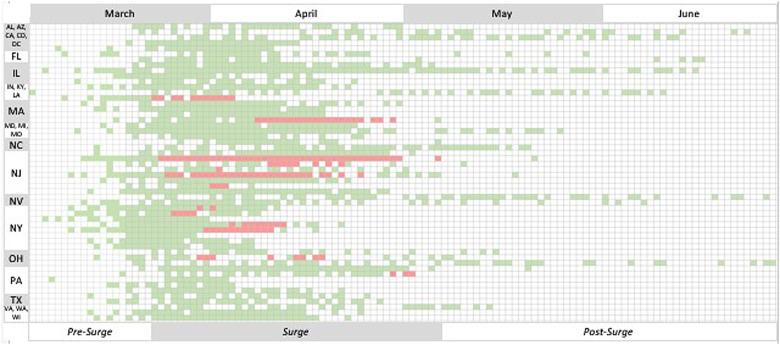
Figure 2.
Distribution of surge and non-surge days for each Cohort hospital.a
aEach row represents a unique cohort hospital (grouped by US State), each column a unique calendar day from March 4 to June 28. Blank squares represent days in which no new ICU admission was recorded in the cohort. Of days with ICU admissions, green squares represent non-surge days (COVID-19 ICU occupancy <100% of baseline ICU capacity) and red squares represent surge days (COVID-19 ICU occupancy ≥100% of baseline ICU capacity).

