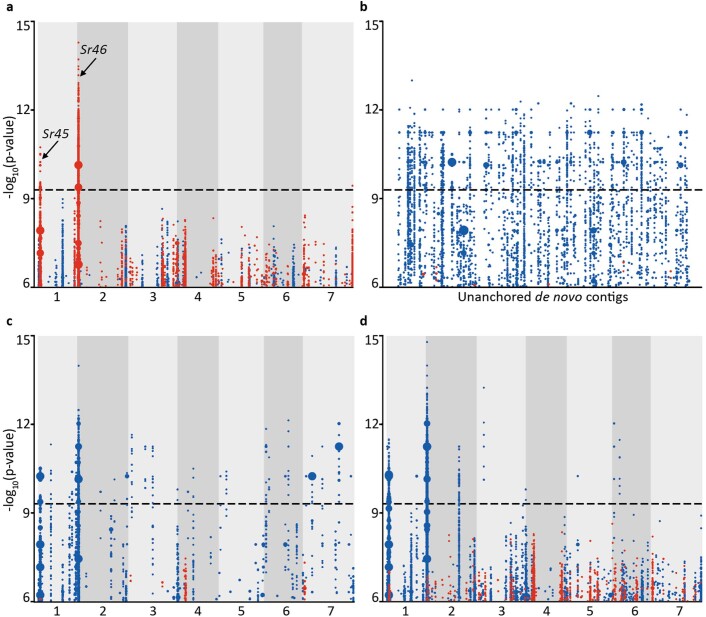
Extended Data Fig. 4. Optimization of k-mer GWAS with the positive controls Sr45 and Sr46.
Blue/red dots on the y-axis represent one or more k-mers significantly associated with resistance/susceptibility, respectively, to Puccinia graminis f. sp. tritici isolate 04KEN156/04 (race TTKSK) across the diversity panel. Definition of association score, threshold, and dot size (which is proportional to the number of k-mers having the specific value on the y-axis), is as in Fig. 2. a, Significantly associated k-mers mapped to AL8/78 which is susceptible to TTKSK. The peaks marked Sr45 and Sr46 contain the non-functional (not providing resistance to TTKSK) alleles of Sr45 and Sr46. The x-axis represents the seven chromosomes of Ae. tauschii reference accession, AL8/78. Each dot column represents a 10 kb interval. b, Significantly associated k-mers mapped to the unordered de novo assembly of TOWWC0112 (N50 1.1 kb), an Ae. tauschii accession resistant to TTKSK. Each dot-column on the x-axis represents an unordered contig from the de novo assembly. c, Significantly associated k-mers mapped to the same assembly of TOWWC0112 as in (b), but now each contig has been ordered by anchoring to the reference genome of AL8/78 (x-axis). d, Association mapping with an improved TOWWC0112 assembly (N50 196 kb) anchored to the AL8/78 reference genome (x-axis).

