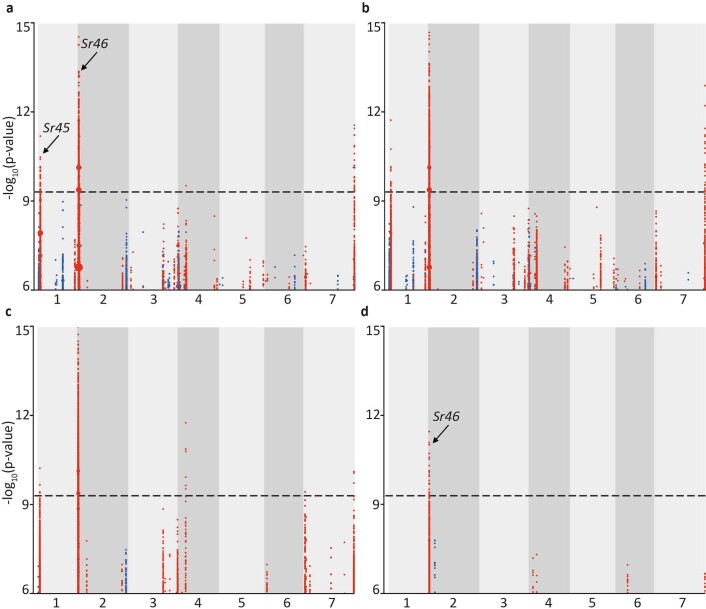
Extended Data Fig. 5. Impact of sequencing coverage on the power to detect the positive controls, Sr45 and Sr46.
Sequencing coverage was artificially reduced by sub-sampling the original 10-fold coverage sequencing reads and mapping associated k-mers to AL8/78. Definition of association score, threshold, and dot size is as in Fig. 2. a, Plot obtained with 7.5-fold coverage (compare with 10-fold coverage in Extended Data Fig. 7a). b, Plot obtained with 5-fold coverage. c, Plot obtained with 3-fold coverage. d, Plot obtained with 1-fold coverage.

