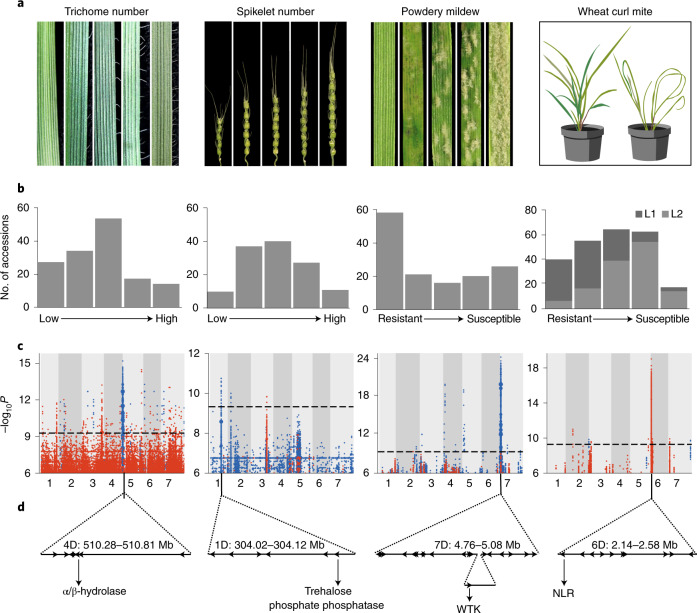
Fig. 3. Genome-wide association mapping in Ae. tauschii for morphology, disease and pest resistance traits.
a, Representation of the scale of phenotypic variation observed. b, Frequency distribution of the different phenotypic scales corresponding to a. L1 and L2 are shown in dark and light gray, respectively. c, k-mer–based association mapping to a de novo assembly of accession TOWWC0112 anchored to the AL8/78 reference genome (trichome number, spikelet number) or accession TOWWC0106 anchored to AL8/78 (response to powdery mildew) or directly mapped to AL8/78 (response to wheat curl mite). k-mer color coding, association score, threshold and dot size are as in Fig. 2. d, Identification of genes under the peak in the GWAS plot with promising candidate(s) indicated. The WTK gene resides within a 60-kb insertion relative to the AL8/78 reference genome.

