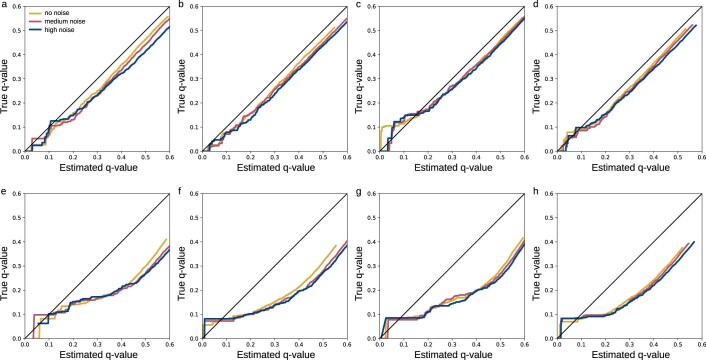
Extended Data Fig. 5. False discovery rate estimation.
Q-Q plot of true vs. estimated q-values with no added noise, medium noise, and high noise. (a–d) cross-validation, N = 3 721. (a) 10 eV, (b) 20 eV, (c) 40 eV, (d) merged spectra. (e–h) Independent data, N = 3 013. (e) 10 eV, (f) 20 eV, (g) 40 eV, (h) merged spectra. The ‘step’ at the beginning of most curves in (e–h) is not an issue of FDR estimation, but due to the fact that no non-zero (true) q-values below this exist in the dataset.

