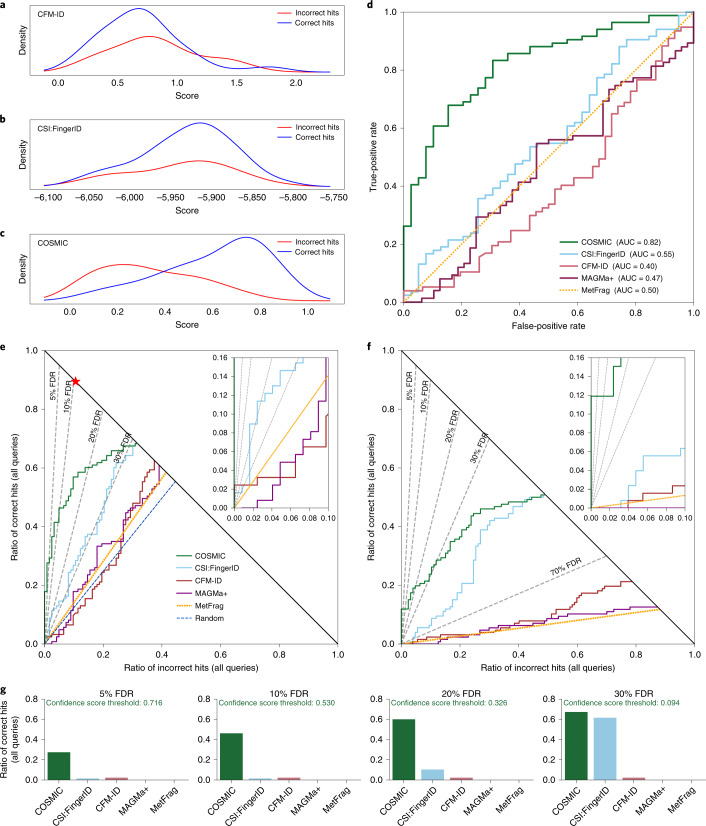
Fig. 2. Separation by hit score for different in silico tools, using the CASMI 2016 contest submissions.
Positive ion mode; candidates retrieved by molecular formula. a–e, Searching the biomolecule structure database (n = 123 queries). f, Searching in ChemSpider (n = 127 queries). a–c, Kernel density estimates of the score mixture distribution (correct and incorrect hits) for CFM-ID (a) and CSI:FingerID (b), ensuring structure–disjoint training data through cross-validation, and COSMIC (c). Kernel density estimates do not allow for a direct comparison of different tools. d, ROC curves for MetFrag, MAGMa+, CFM-ID, CSI:FingerID (ensuring structure–disjoint training data) and COSMIC. MetFrag normalizes scores, so the ordering of hits is exactly random. e,f, Hop plots for the same tools, searching the biomolecule structure database (e) or ChemSpider (f). FDR levels are shown as dashed lines; FDR levels are exact, not estimated (Methods). The blue dashed line in e indicates random scores, resulting in random ordering of candidates and hits; the red star in e is the best possible search result. g, Bar plots for the ratio of correct hits returned at FDR 5%, 10%, 20% and 30%, searching the biomolecule structure database. Again, FDR levels are exact. This information can also directly be read from the hop plot (e) (see Extended Data Fig. 1 for details). We also report COSMIC’s confindence score thresholds corresponding to each level. a–g, CSI:FingerID and COSMIC are computed here; all other scores are from ref. 18.

