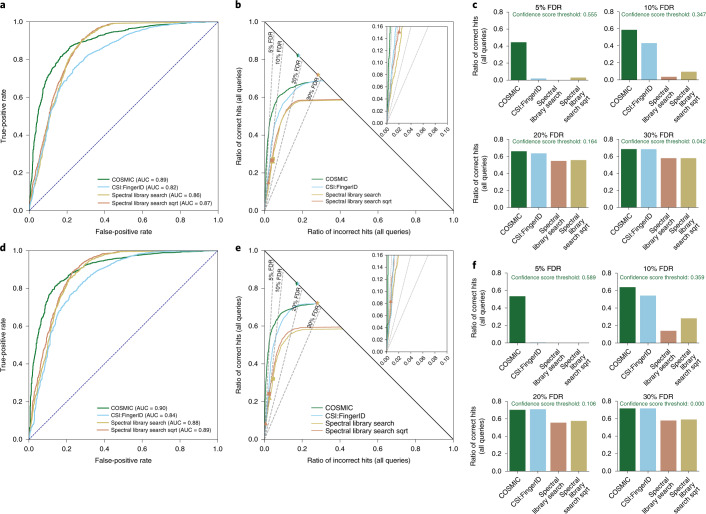
Fig. 5. Comparison to spectral library search and separation without structure–disjoint evaluation.
Query spectra (independent dataset) distorted with medium noise. COSMIC is searching the biomolecule structure database. ROC curves (a,d), hop plots (b,e) and bar plots (c,f) for collision energy 20 eV (a–c) and merged spectra (d–f). Bar plots (c,f) for FDR levels 5%, 10%, 20% and 30%. There is no overlap in fragmentation spectra between training data and independent data, but we do not remove training data for which we find the same structure in the independent dataset. To this end, 2,192 of the n = 3,013 structures from the independent dataset (72.75%) are also present in the spectral library. We compare search performance and separation of COSMIC, the CSI:FingerID score and spectral library search. All three methods use basically the same MS/MS data. For spectral library search, we compute the normalized dot product using either regular peak intensities or the square root of peak intensities (‘Spectral library search sqrt’)46. Spectral library search candidates were restricted to those with the correct molecular formula for each query. Query spectra are QTOF MS/MS data, whereas the spectral library contains a mixture of QTOF and Orbitrap MS/MS data. The spectral library is 16-fold smaller than the biomolecule structure database, giving library search a large competitive edge in evaluation. Notably, COSMIC results in substantially more correct annotations than library search for all reasonable FDR levels; FDR levels are exact, not estimated (Methods). For spectral library search, markers show commonly used cosine score thresholds 0.9 (triangle) and 0.8 (square), respectively. Finally, stars indicate the best possible annotation results, for CSI:FingerID/COSMIC and library search. sqrt, square root.

