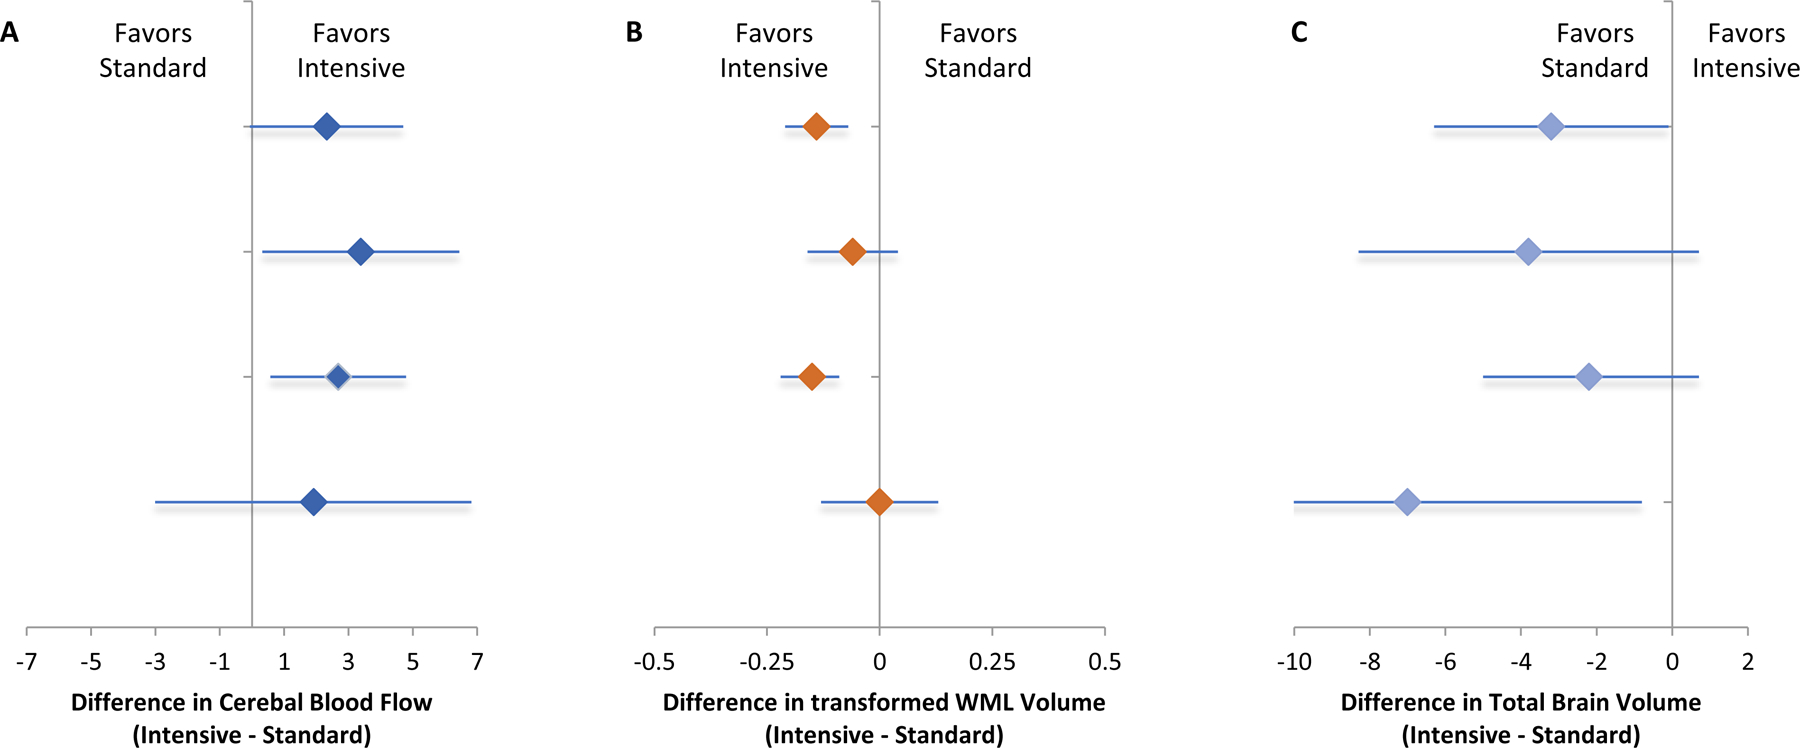
Figure 2.

Effect of intensive versus standard BP treatment on change in cerebral blood flow (Panel A), white matter lesion volume (Panel B), and total brain volume (Panel C), by baseline estimated glomerular filtration rate and urine albumin to creatinine ratio. Note: Units are expressed as ml/100 g/min for cerebral blood flow, asinh (cm3) for white matter lesion volume, and cm3 for total brain volume.
