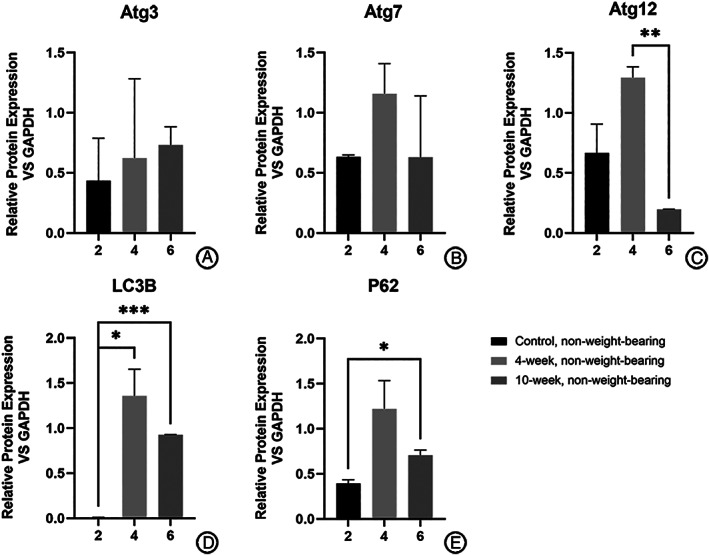
Fig. 5.

Difference in expression of autophagy‐related proteins in chondrocytes from non‐weight‐bearing cartilage with different OA severity (calculated relative integrated density of the bands). Expression of Atg12 in the 4‐ week group was higher than that of the 10‐week group (C) while expression of LC3B in the 4‐week group was higher than that of the control group (D). The expression of LC3B (D) and P62 (E) in the 10‐week group was higher than that of the control group.
