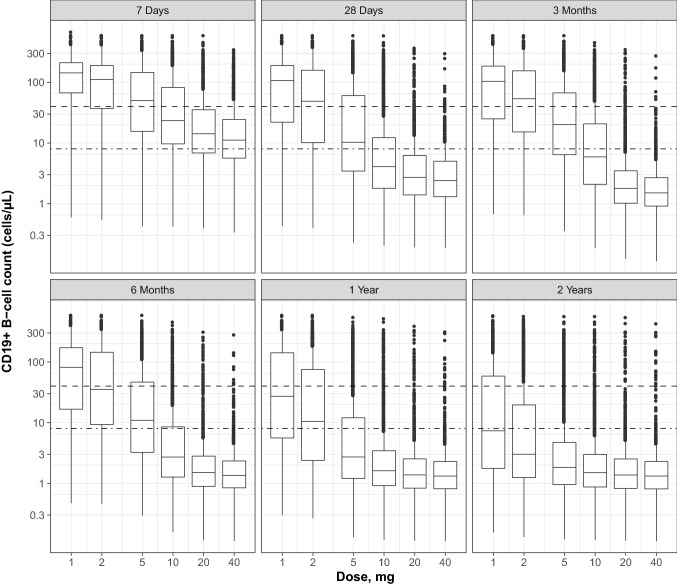
Fig. 4.
Relationship between ofatumumab doses and B cell depletion at 7 days, 28 days, 3 months, 6 months, 1 year, and 2 years. Box and whisker plots of simulated B cell counts (middle line = median; box = 25th and 75th quartiles [IQR]; lower/upper lines = 1.5 × IQR; points = outliers); simulations performed for the various dosage regimens administered SC with the prefilled syringe with the standard phase 3 schedule (i.e., three loading doses given weekly followed by monthly doses) and for the patient population included in the five studies. The dashed line indicates the B cell counts at lower limit of normal level (40 cells/µL); the dash-dotted line indicates the B cell target (8 cells/µL). IRQ interquartile range, SC subcutaneously

