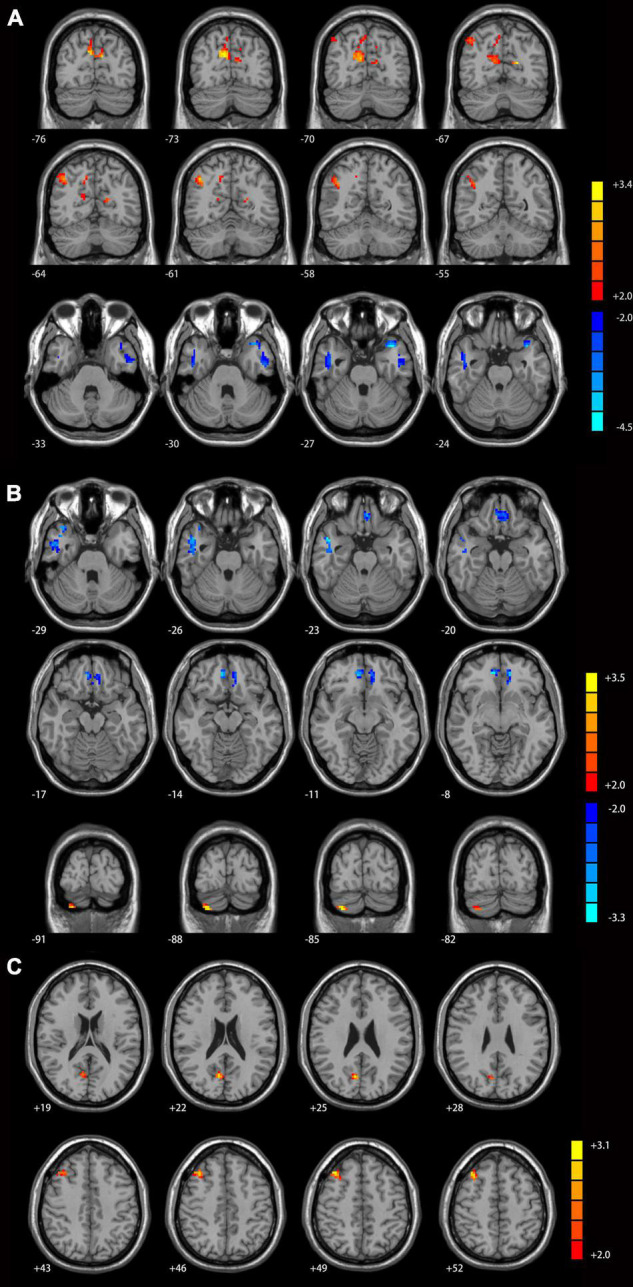
FIGURE 2.

Cerebellar connectivity differences between major depressive disorder (MDD) patients with GI symptoms and healthy controls [(A) seed left Crus I; (B) seed right Crus I; (C) seed lobule IX]. The color bar indicates the T values. Results were GRF corrected. GI, gastrointestinal symptoms; GRF, Gaussian random field correction.
