FIGURE 6.

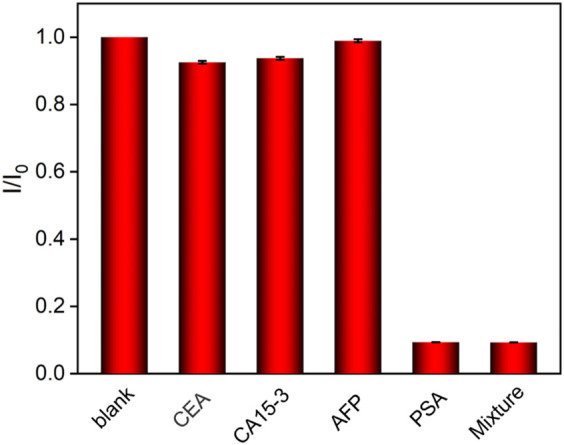
Relative ratio of ECL intensity before (I0) and after (I0) incubation with buffer (blank), CEA (500 ng ml−1), CA15-3 (500 ng ml−1), AFP (500 ng ml−1), PSA (0.1 ng ml−1), or protein mixture (0.1 ng ml−1 PSA + 500 ng ml−1 other proteins).

Relative ratio of ECL intensity before (I0) and after (I0) incubation with buffer (blank), CEA (500 ng ml−1), CA15-3 (500 ng ml−1), AFP (500 ng ml−1), PSA (0.1 ng ml−1), or protein mixture (0.1 ng ml−1 PSA + 500 ng ml−1 other proteins).