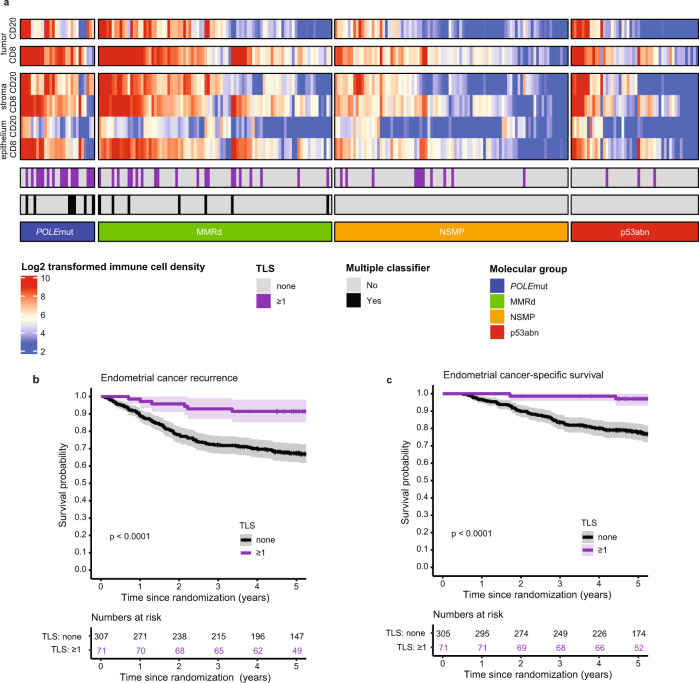
Fig. 4. Relation between molecular group, TLS and CD8 densities and prognosis in high-risk endometrial cancer.
a Heat map of included PORTEC-3 patients (N = 378) with available data on molecular classification, TLS, CD8+ and CD20+ densities (N = 252). Each patient is represented by a row in the graph. Clustering of CD8+ and CD20+ densities stratified by molecular group was done by hierarchical clustering using Ward’s minimum variance method. b Endometrial cancer recurrence-free survival calculated according to Kaplan-Meier’s methodology using the log rank test (two-sided alpha of 0.05) for all included PORTEC-3 patients (N = 378). c Endometrial cancer-specific survival calculated according to Kaplan-Meier’s methodology using the log-rank test (two-sided alpha of 0.05) for all included PORTEC-3 patients (N = 378).

