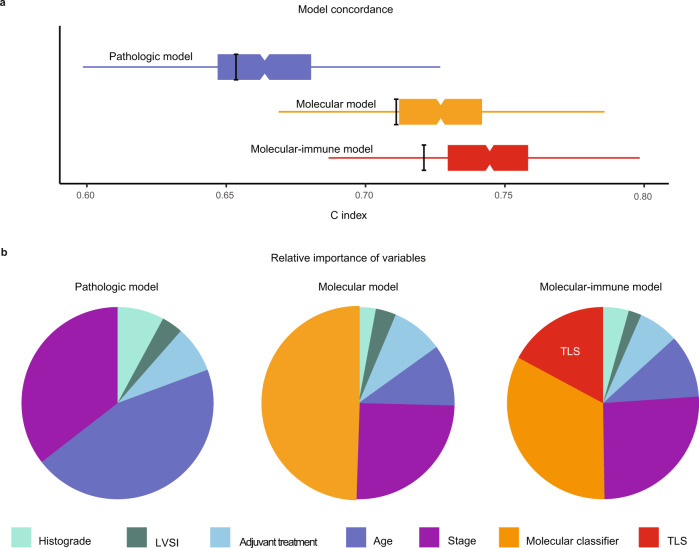
Fig. 5. Characteristics of prognostic models in high-risk endometrial cancer.
a Boxplots showing concordance (C index) of the pathologic model, molecular model and the molecular-immune model. Box and whisker (Tukey) plots use results of 1000 bootstrap resamples from study population; lower and upper limits of box indicate 25th and 75th percentiles; and whiskers extend to 1.5x interquartile range below and above these values, respectively. The thick black bars indicate the C index from original population. b Pie charts showing relative importance of variables within these three multivariable models based on the proportion of the χ2 statistic. LVSI Lymphovascular space invasion; TLS Tertiary lymphoid structure.

