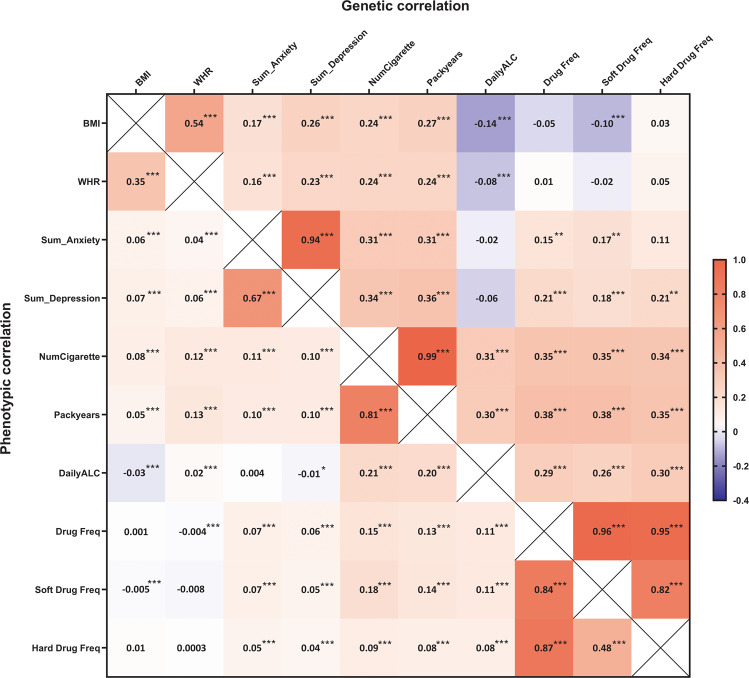
Fig. 4. Genetic and phenotypic correlations between obesity, anxiety, depression and substance use.
BMI, body mass index; WHR, waist-hip-ratio; Sum_Anxiety, sum score of 10 items related to anxiety from MINI; Sum_Depression, sum score of 10 items related to depression from MINI; NumCigarette, number of cigarettes per day; DailyALC, daily alcohol intake; Drug Freq, lifetime drug use frequency; Soft Drug Freq, lifetime soft drug use frequency; Hard Drug Freq, lifetime hard drug use frequency; rG: genetic correlation; rP: phenotypic correlation. rG and rP adjusted for age, age2 and sex. P-value(0): the difference of rG /rP from 0, ***p < 0.001, **p < 0.01, *p < 0.05. We also test the difference of rG from 1, only rG between Numcigarette and Packyears had non-significant difference from 1.

