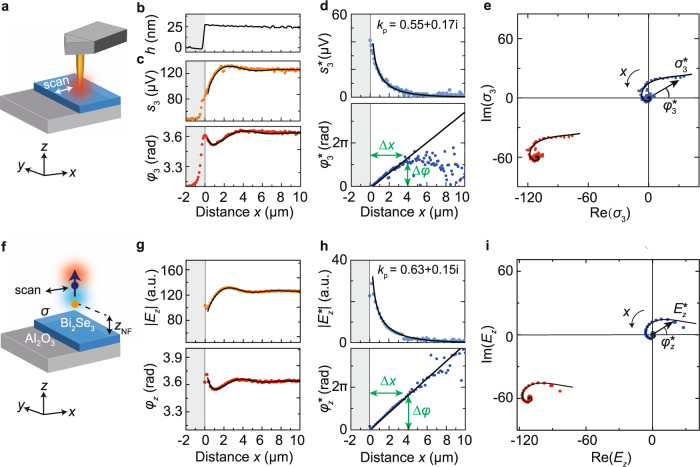
Fig. 2. Complex-valued analysis of THz near-field line profiles of a 25-nm-thick Bi2Se3 film.
a Sketch of the s-SNOM experiment. b Topography line profile, showing the height h as measured by AFM. c Experimental s-SNOM amplitude and phase line profiles recorded at 2.52 THz. d Amplitude and phase line profiles obtained from the data shown in panel c after subtraction of the complex-valued signal offset C at large distances . e Representation of near-field line profiles in the complex plane. Data corresponding to panel c are shown in red color, data corresponding to panel d are shown in blue color. c–e The black solid lines show the fitting of the experimental data by a radially and exponentially decaying wave, , where C is a constant complex-valued offset. f Simulation of s-SNOM line profiles: A vertically orientated dipole source (mimicking the tip) is located 1.5 μm above a sheet of conductivity σ (blue, mimicking the Bi2Se3 layer) on Al2O3. The electric field Ez below the dipole at height zNF = 200 nm above the conductivity sheet is calculated and plotted as function of the distance x between the dipole and the sheet edge. g–i Simulated amplitude and phase line profiles analogous to panels c–e. The conductivity was obtained from Eq. (2) with = 0.55 + 0.17i μm−1. For better comparison between the experimental and simulation results, the offset C in the simulations (red data) was replaced by the experimental offset and the phases in panels d and h were set to zero a x = μm.

