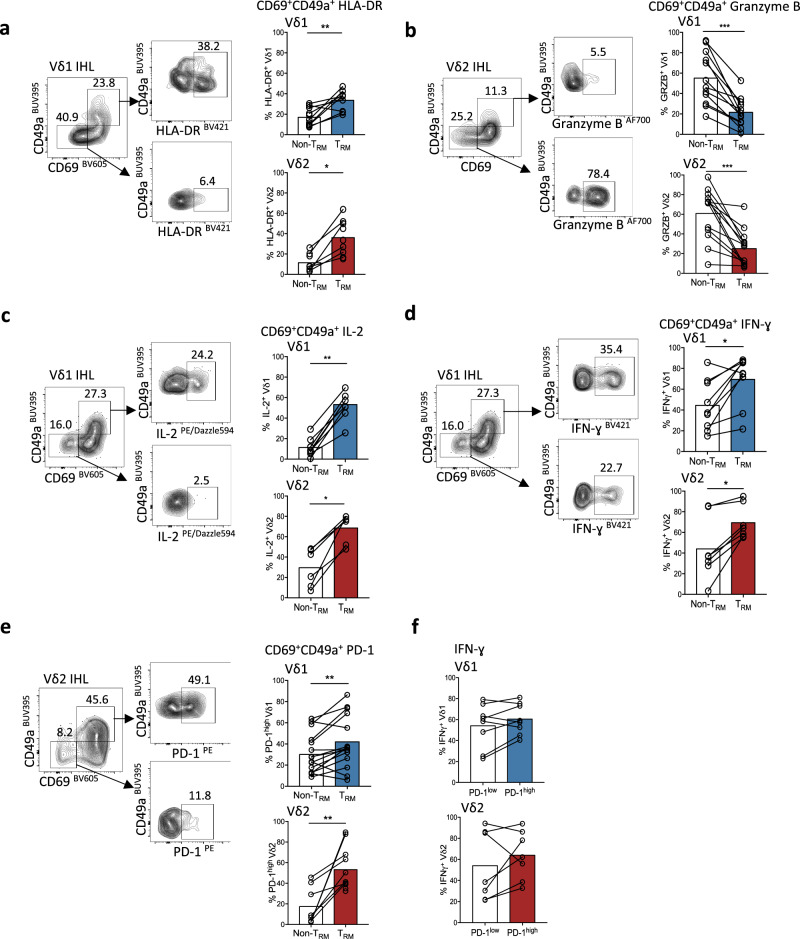
Fig. 3. Distinct functional profile of hepatic γδTRM.
a–e Representative flow cytometry plots and summary data of ex vivo functional profile of intrahepatic CD69+CD49a+ Vδ1 and Vγ9Vδ2 TRM compared to non-TRM (CD69−CD49a−) counterparts. a HLA-DR expression (n = 13; Vδ1 p = 0.008; Vγ9Vδ2 p = 0.03). b unstimulated Granzyme B expression (n = 17; Vδ1 p = 0.0005; Vγ9Vδ2 p = 0.0002). c IL-2 expression following 4 h PMA and Ionomycin stimulation (n = 10; Vδ1 p = 0.004; Vγ9Vδ2 p = 0.03). d IFN-γ expression after 4 h PMA and Ionomycin stimulation (n = 10; Vδ1 p = 0.01; Vγ9Vδ2 p = 0.02). e unstimulated programmed death-1 (PD-1) expression (n = 11; Vδ1 p = 0.007; Vγ9Vδ2 p = 0.008). f IFN-γ expression by PD-1high and PD-1low intrahepatic Vδ1 and Vγ9Vδ2 T-cells after 4 h PMA and Ionomycin stimulation (n = 8; p value non-significant). Each symbol represents a study participant, with bars showing the mean (a–f); two-tailed p-values were determined using Wilcoxon matched-pairs signed rank test (a–f). *p < 0.05; **p < 0.01; ***p < 0.001.

