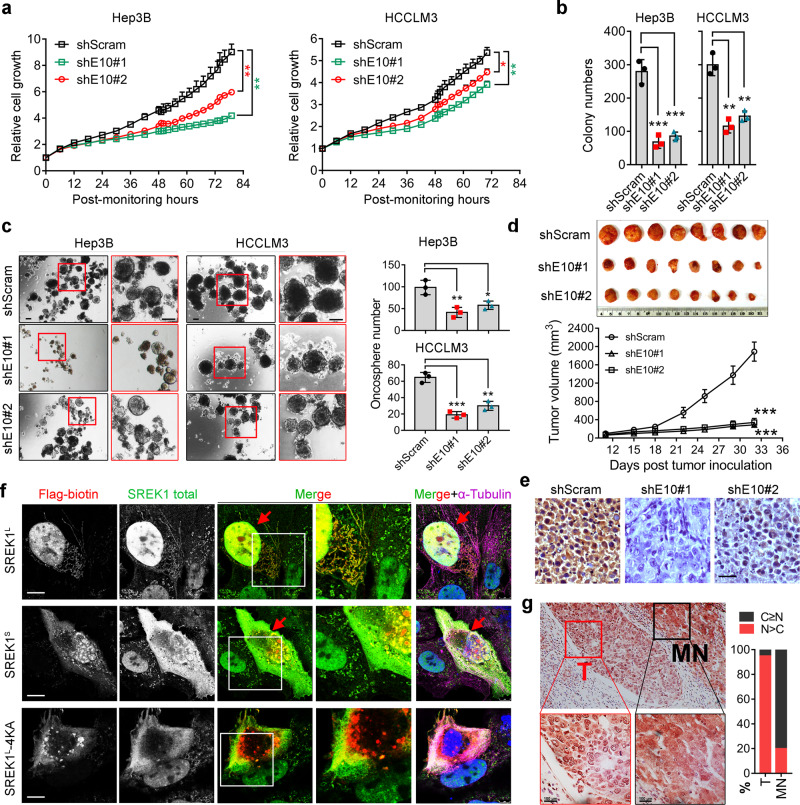
Fig. 2. SREK1L is an oncogenic driver with nuclear localization in HCC.
a Cell growth analysis (n = 3), data are shown as the mean ± SEM. b Anchorage-independent soft agar colony formation assays (n = 3), and c oncosphere assays (n = 3) of cells in which scramble control or exon 10-specific SREK1 was stably knocked down (scale bar = 200 μm), data are shown as the mean ± SD. d Mouse tumorigenic assays of Hep3B cells with scramble control or exon 10-specific SREK1 stably knocked down (n = 8, data are shown as the mean ± SEM). e The immunohistochemical staining of the representative xenograft tumor tissues, scale bar = 100 μm. f Confocal microscopy showing immunofluorescence staining for Flag-tagged SREK1L and SREK1S (shown in red) and their colocalization with endogenous SREK1 (shown in green), microtubules (shown in purple) and nuclei (stained with DAPI, shown in blue) in HCCLM3 cells. Scale bar = 5 μm. g Representative immunohistochemical staining of HCC patient tissues for endogenous SREK1 (Scale bar = 100 μm, left panel); T tumor tissues, MN matched normal tissues, C cytoplasm, N nucleus. The amount of SREK1 in the cytoplasm or nuclei of cells in tumor or matched normal tissues from HCC patients was quantified (n = 10, right panel), C>N indicates more specific SREK1 detected in the cytoplasm, N>C indicates more specific SREK1 staining in the nucleus. Two-tailed, unpaired t test is used for statistical analysis of (a, b, c, e), *p < 0.05; **p < 0.01; ***p < 0.001. Source data are provided as a Source Data file.

