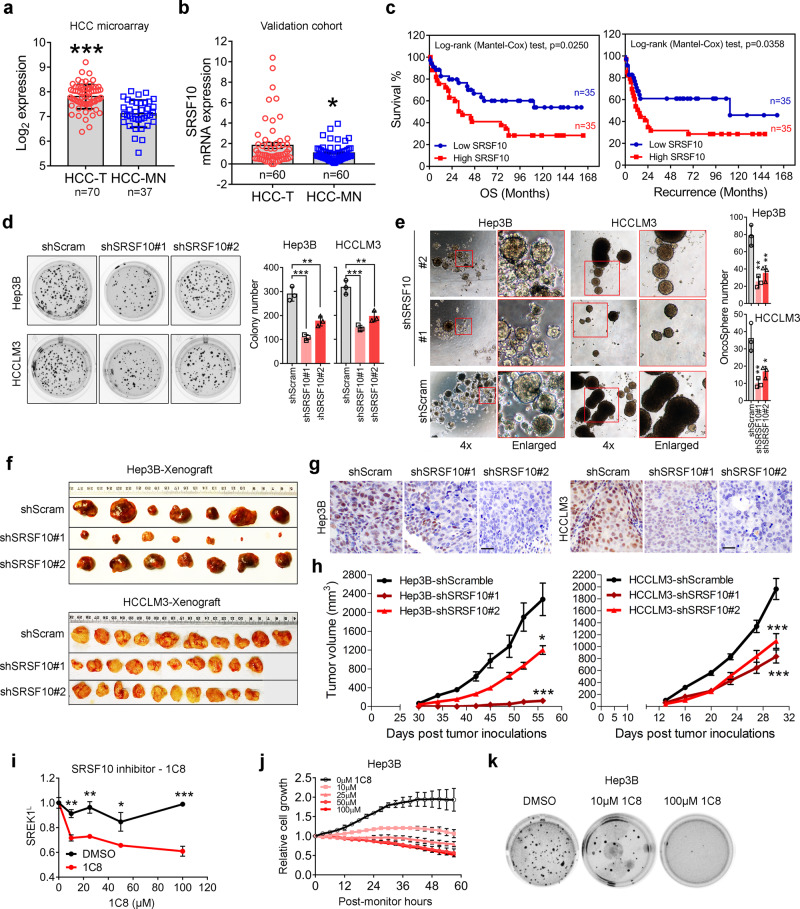
Fig. 6. SRSF10 is associated with poor prognosis of HCC patients and acts as an oncogenic driver in HCC.
Expression of SRSF10 in HCC-T and HCC-MN using a a microarray database generated in our laboratory35 or b PCR assay on a HCC cohort composed by 60 pairs HCC tissues (two-tailed, paired t test). c Comparison of OS and recurrence between HCC patients with high or low SRSF10 expression analyzed by our microarray database25, 35. d Anchorage-independent soft agar colony formation assay (n = 3) or e the oncosphere formation assays of the effect of SRSF10 or scramble control stable knockdown in HCCLM3 and Hep3B cells (n = 3). The representative tumor pictures (f), immunohistochemical staining (scale bar = 100 μm) (g), and tumor volume (h) of the mouse subcutaneous tumorigenic assay of the effect of SRSF10 or scramble control stable knockdown on the tumorigenesis of the Hep3B (n = 7) or HCCLM3 (n = 10) cells. Mean ± SEM; *p < 0.05; ***p < 0.001. i The inhibition of the 1C8, an SRSF10 inhibitor, on SREK1L expression in Hep3B cells. j The cell growth and k the anchorage-independent soft agar colony formation assays of 1C8 on the inhibition of Hep3B cells (n = 3). Mean ± SD, *p < 0.05; **p < 0.01; ***p < 0.001, two-tailed, unpaired t test is used for (a, d, e, h, i) for; *p < 0.05; **p < 0.01; ***p < 0.001. Source data are provided as a Source Data file.

