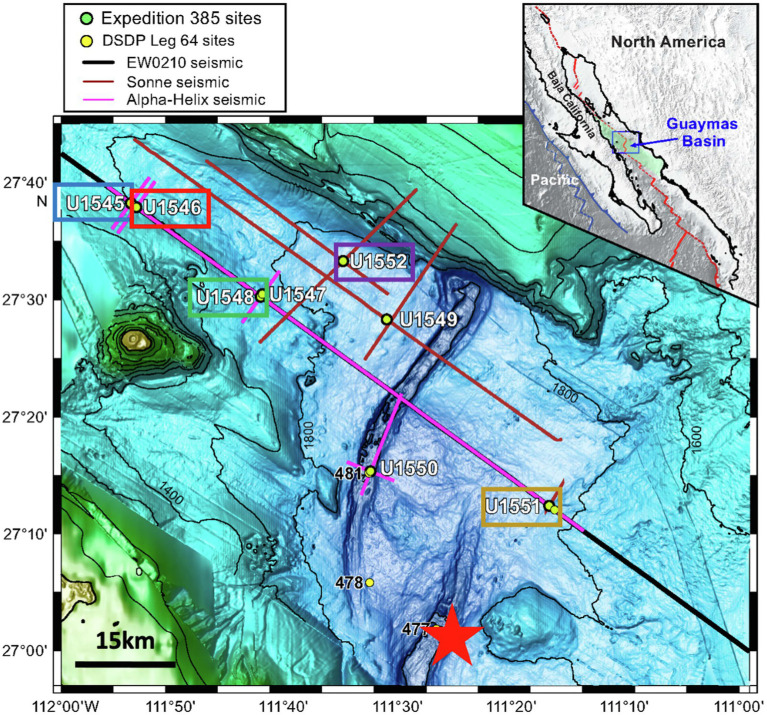
Figure 1.
Sampling sites in Guaymas Basin. Image adapted from Teske et al. (2020). Colored boxed indicate sampling sites where SRR could be measured. The color scheme is used for data plotted in Figures 2–4. The red line in the insert map is the boundary between the North American and Pacific tectonic plates. The red star in the map indicates the sampling site of Elsgaard et al. (1994).

