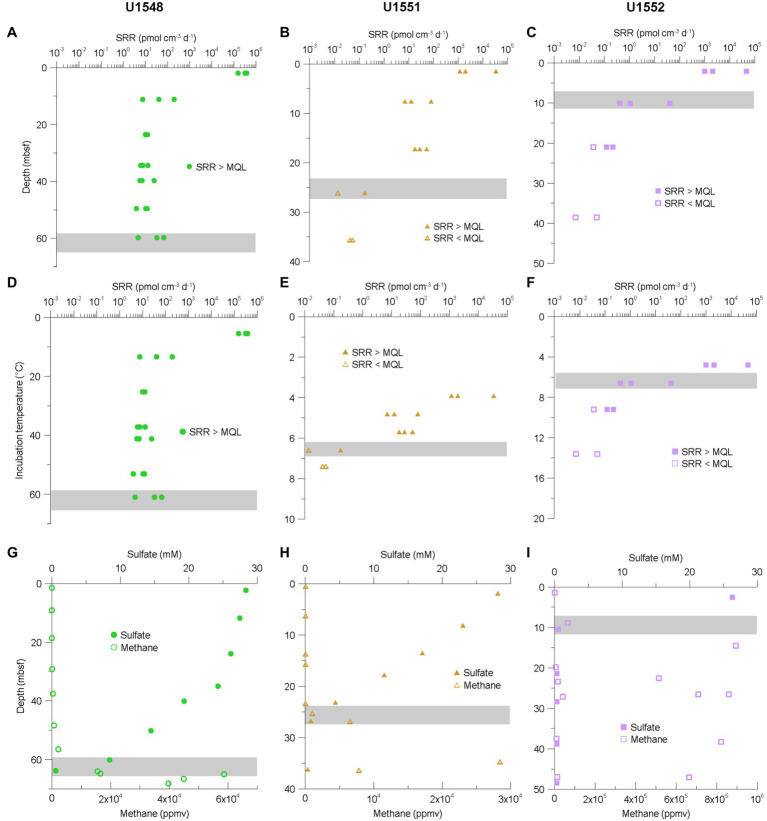
Figure 4.
(A–C) SRR for sites U1548C (green circles), U1551B (brown triangles), and U1552B (purple squares) plotted against sampled depth. (D–F) SRR for same sites plotted against incubation temperature. (G–I) Concentrations of sulfate and methane. The data were obtained from the Laboratory Information Management System (LIMS) report. Gray bar indicates Sulfate–Methane Transition Zone (SMTZ). Note the different scales on the graphs.

