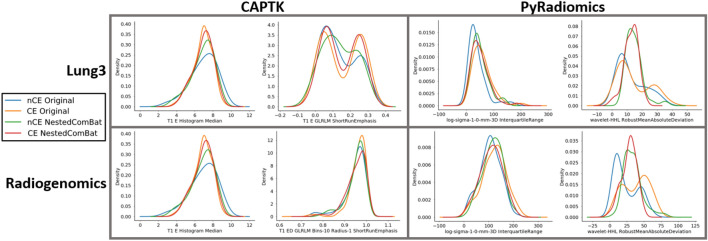
Figure 1.
Representative kernel density plots for the original features and after applying Nested ComBat. Kernel density plots represent Nested ComBat results split on contrast enhancement, where nCE indicates no enhancement and CE indicates enhancement. Harmonization should result in more similar feature distributions. Within each combination of feature extraction package and software, the plot on the left illustrates the effect of Nested ComBat on a Gaussian distribution, while the plot on the right illustrates the effect of Nested ComBat on a bimodal distribution.

