Figure 1.
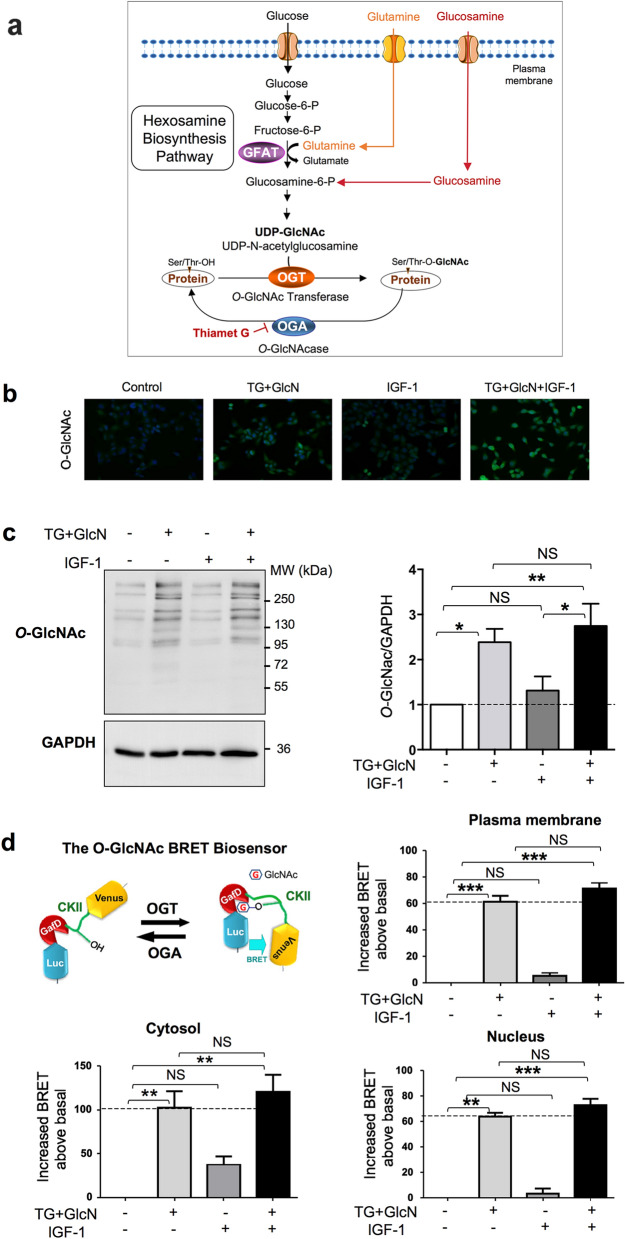
Effect of Thiamet-G and glucosamine on O-GlcNAcylation levels in CaSki cells. (a) Glucose and glutamine metabolism in the hexosamine biosynthesis pathway (HBP) leads to the production of UDP-GlcNAc (Uridine 5-diphospho N-acetylglucosamine), the substrate used by OGT for O-GlcNAcylation of cytosolic, nuclear and mitochondrial proteins. The rate-limiting step of the HBP is catalysed by GFAT (glutamine fructose-6-phosphate amidotransferase) which uses glutamine to convert fructose-6 phosphate into glucosamine-6 phosphate. Experimentally, the level of O-GlcNAcylation of proteins can be increased by incubating cells with glucosamine (which bypasses the GFAT rate-limiting enzyme), or with Thiamet G, which inhibits deglycosylation of proteins by OGA. (b) CaSki cells were grown in 1% FBS and cultured in the absence or presence of TG (10 µM for 24 h) and GlcN (5 mM for 6 h) and then stimulated with IGF-1 (5 nM for 10 min). Cells were fixed and immunofluorescence imaging was performed using anti-O-GlcNAc antibody (green). DAPI (blue) was used to visualize the nucleus. Representative images are shown. (c) Cells were cultured in 1% FBS and cultured in the absence or presence of TG (10 µM) for 24 h, GlcN (5 mM) for 6 h and IGF-1 (5 nM) for 10 min. Cell lysates were collected and analysed by western blot with anti-O-GlcNAc antibody (the uncropped western-blots are shown on the Supplementary Information file S1). The histogram represents the means ± SEM of 8 independent experiments. (d) The BRET O-GlcNAc biosensor is composed of Rluc8 luciferase fused to a lectin domain (GafD), followed by a known OGT substrate peptide derived from casein kinase II (CKII), and then by the Venus variant of the yellow fluorescent protein. Upon its O-GlcNAcylation, the casein kinase peptide binds to the lectin, resulting into a conformational change detected as an increased BRET signal. Cells were transfected with cDNAs coding for cytosol-, nucleus- and plasma membrane-targeted BRET O-GlcNAc-biosensors. Results are expressed in milliBRET units (mBU) as increased BRET above basal induced by the different agents, and are the means ± SEM of 6 independent experiments. Statistical analysis was performed using ANOVA followed by Tukey’s post-test. *, **, ***p < 0.05, p < 0.01 and p < 0.001, respectively. NS non-significant.

