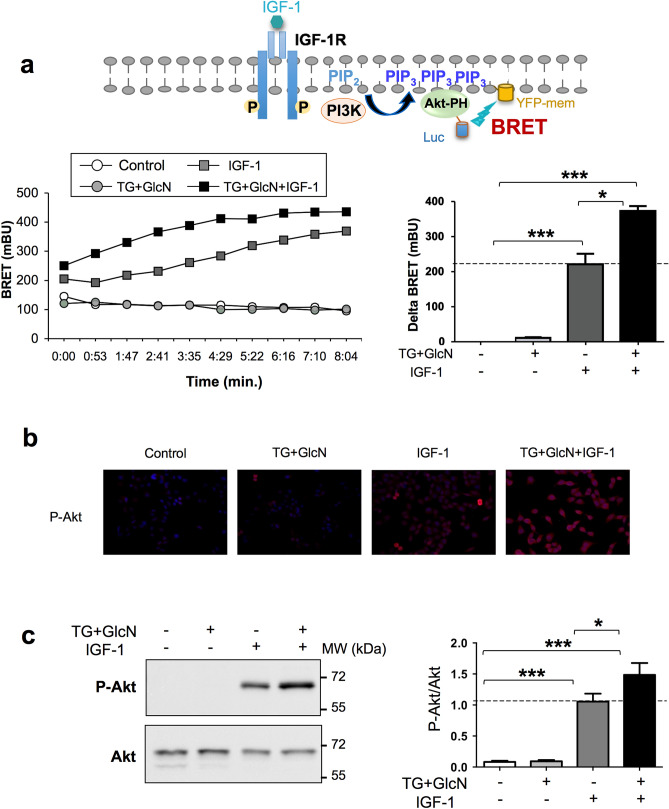
Figure 4.
O-GlcNAcylation-inducing treatments increase IGF-1 effects on PI-3 kinase/Akt pathway in CaSki cells. (a) Activation of PI-3 kinase induces the phosphorylation of phosphatidyl-inositol 2 phosphate (PIP2) into phosphatidyl-inositol 3 phosphate (PIP3) and subsequent recruitment of Akt to the plasma membrane through its pleckstrin homology (PH) domain. CaSki cells were co-transfected with cDNAs coding for the PH domain of Akt fused to a luciferase (Luc-Akt-PH) and a plasma membrane-targeted YFP (YFP-mem). 24 h after transfection, cells were cultured in the presence of 1% FBS in the absence or presence of TG (10 µM for 24 h) and GlcN (5 mM for 6 h). Cells were incubated with coelenterazine for 10 min, and then stimulated with IGF-1 (5 nM). Light emission acquisition at 480 nm and 532 nm was started immediately after IGF-1 addition. Results were expressed in miliBRET units (mBU). Left panel: a typical real-time experiment showing the effect of O-GlcNAcylation-inducing treatment on IGF-1-induced PIP3 production in CaSki cells. Right panel: Results are expressed as the delta BRET (increased BRET above basal) and are the means ± SEM of 6 independent experiments. (b) CaSki cells were cultured in the presence of TG (10 µM) for 24 h and GlcN (5 mM) for 6 h, stimulated with IGF-1 for 10 min, and then fixed and incubated with P-Akt antibody. Representative images of immunofluorescence with P-Akt (red) and dapi staining of cell nuclei (blue) are shown. (c) CaSki cells were cultured in the presence of TG (10 µM for 24 h) and GlcN (5 mM for 6 h), stimulated with IGF-1 for 10 min, and then lysed. Proteins were submitted to western-blotting and Akt phosphorylation was detected with anti-phospho-Akt antibody (the uncropped western-blots are shown on the Supplementary Information file S1). The histogram represents the ratio of P-Akt/Akt signals obtained by densitometric analysis of the blots. Results are the means ± SEM of 8 independent experiments. Statistical analysis was performed using ANOVA followed by Tukey’s post-test. *, ***p < 0.05, p < 0.001, respectively. NS non-significant.

