Figure 5.
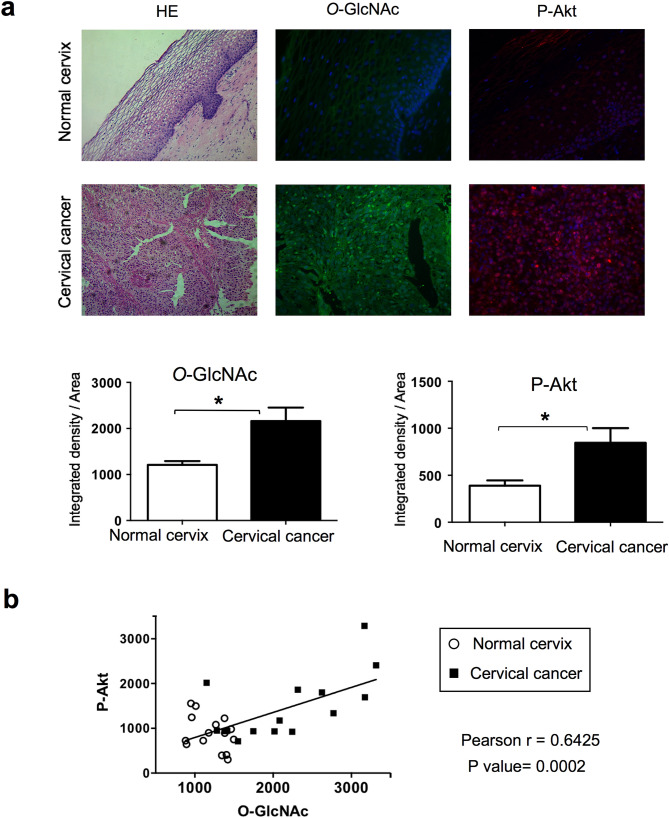
O-GlcNAcylation and Akt phosphorylation levels in cervical cancer tissues. (a) Tissues were stained with Hematoxylin/Eosin (HE). Indirect inmunofluorescence was performed using indicated primary antibodies followed by secondary antibodies (FITC-conjugated anti-mouse and biotinylated anti-rabbit/Alexa Fluor 594). Representative merged images of immunofluorescence staining for O-GlcNAc (green), P-Akt (red) and cell nuclei (blue) of normal and cervical cancer-tissues are shown. The histograms display the relative quantification of the mean fluorescence integrated density by Image J software. Data are means ± SEM of n = 5 tissues, analysing each tissue in at least 3 different optical fields. Statistical analysis was performed using a Student’s t-test. *p < 0.05. (b) Positive correlation between O-GlcNAc and phopho-Akt signals in samples from normal and cervical cancer-tissues evaluated by Pearson analysis.

