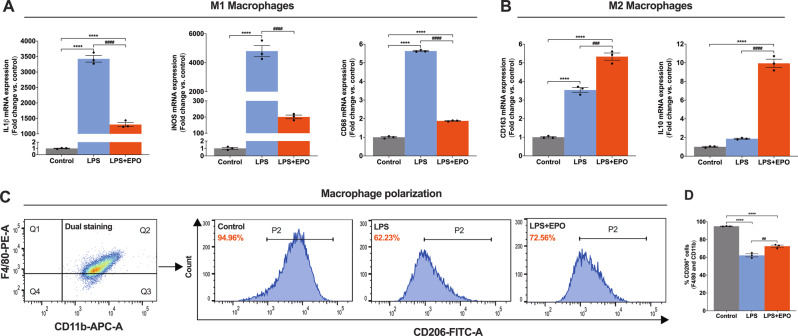
Fig. 5. EPO treatment promotes BMMØs phenotype transition following LPS treatment.
qRT-PCR data shows that EPO treatment significantly attenuates pro-inflammatory genes (IL1β, iNOS, and CD68; M1 macrophage markers) (A) and upregulates anti-inflammatory genes (IL10 and CD163; M2 macrophage markers) (B) following LPS treatment. BMMØs treated with LPS (50 ng/mL) for 24 h and EPO (5 IU/mL) for 72 h. (C). Flow cytometry gating strategy of dual staining BMMØs (CD11b + F4/80), where that shows (P2, histograms) LPS + EPO treatment significantly shifts expression of CD206+ M2 phenotype macrophages as compared to LPS treatment, and the results are represented as a bar graph (D). One-way ANOVA, Tukey’s multiple comparisons test. Data were expressed as means ± SEM, ****P < 0.0001, Control vs. LPS and LPS + EPO; ###P < 0.0002, and ####P < 0.0001, LPS vs. LPS + EPO, n = 3.

