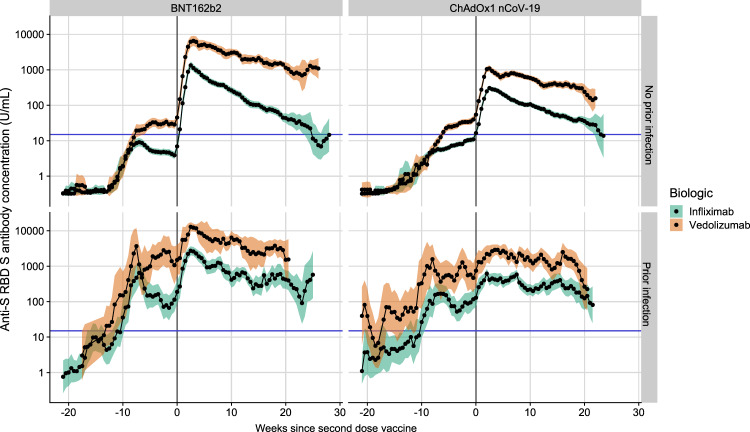
Fig. 5. Rolling geometric mean antibody concentration over time from the date of the second dose of the SARS-CoV-2 vaccine (week 0) stratified by biologic therapy (infliximab vs vedolizumab), vaccine and history of prior SARS-CoV-2 infection.
Geometric means are calculated using a rolling 15-day window (i.e. 7 days on either side of the day indicated). The shaded areas represent the 95% confidence intervals of the geometric means. The horizontal blue line represents the seroconversion threshold (15 U/mL). The number of participants included at each time point is presented in Supplementary Fig. 2. Overall, data from 4474 participants with no history of prior infection (3029 on infliximab and 1445 on vedolizumab) and 1179 participants with a history of prior infection (833 on infliximab and 346 on vedolizumab) were included in this graph between 22 weeks before and 29 weeks after the second vaccine dose. The biologic treatment infliximab is shown in green and vedolizumab is shown in orange. Source data are provided as a Source Data file.

