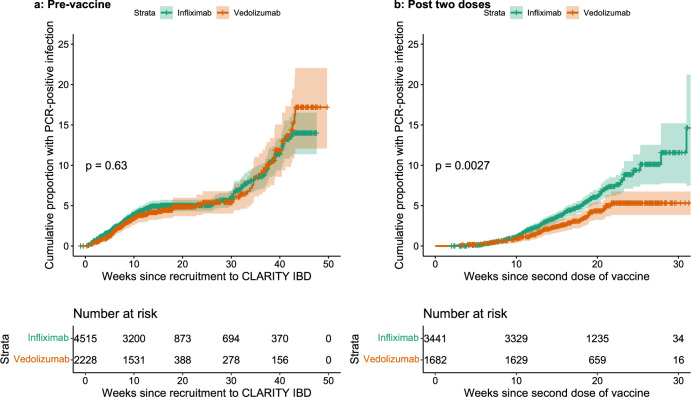
Fig. 6. Kaplan–Meier graphs comparing the time to PCR-confirmed SARS-CoV-2 infection stratified by biologic therapy (infliximab vs vedolizumab) in participants before vaccination and after receiving two doses of vaccine.
a The time to PCR-confirmed SARS-CoV-2 infection in participants who have not received any dose of either vaccine stratified by biologic therapy (infliximab vs vedolizumab). b The time to a PCR-confirmed SARS-CoV-2 breakthrough infection in participants following two doses of either vaccine stratified by biologic therapy. The biologic treatment infliximab is shown in green and vedolizumab in orange. The number of participants at each time point are displayed in black at the bottom of each figure. P values are calculated using the log-rank test. Source data are provided as a Source Data file.

