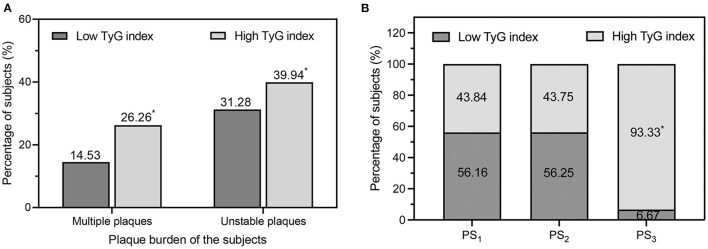
Figure 2.
(A) Comparison of the percentage of multiple plaques and unstable plaques in the low TyG index group and high TyG index group. (B) Percentages of low/high TyG index values in different categories of carotid plaque burden degree. PS1, low plaque burden; PS2, moderate plaque burden; PS3, high plaque burden. PS, plaque score; TyG, triglyceride-glucose. *P < 0.01 vs. low TyG index.

