
FIGURE 3.
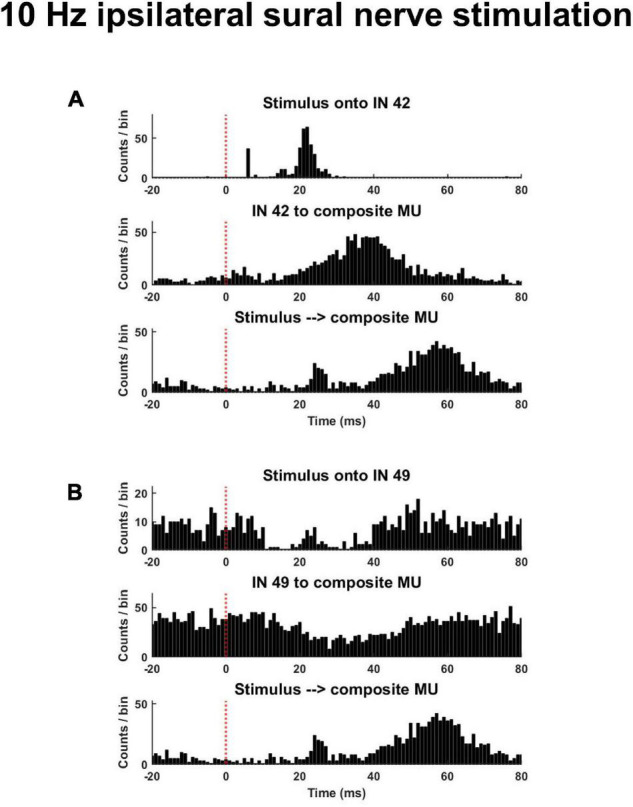
Exemplar peristimulus time histograms during a trial of low frequency (10 Hz) ipsilateral sural nerve stimulation. (A) Shown is an interneuron that displayed an increased probability of discharge in response to the stimulus and whose discharge was associated with an increased probability of motor unit discharge [(A), middle panel]. (B) Displayed is an interneuron that displayed a reduced probably of discharge and whose discharge was associated with a decreased probably of motor unit discharge [(B), middle panel]. The same composite motor unit spike train in response to the stimulus is shown on the bottom panel of panels (A,B).