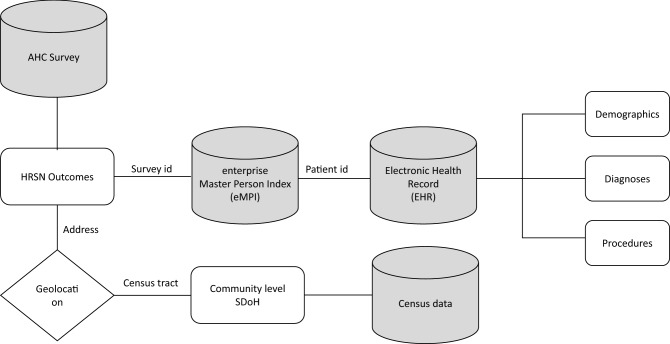
Figure 1.
Data sources and linkage for modeling. Flow chart showing the data sources combined to create the dataset displayed. The data sources are displayed as three cylinders displaying the data linking between sources. The measures from each source are displayed as a rectangle linking to other cylinders. Patient-level HRSNs were collected in the AHC screening survey. Using survey demographic data, patients were mapped using a Master Patient Index database (MPI) to patient ID, demographics, diagnosis, and procedures in the EHR. Patients addresses provided in the survey and the EHR were geocoded to each patient’s address and corresponding Census tract. The geocoding is displayed as a diamond connected to the HRSN survey data measures.

