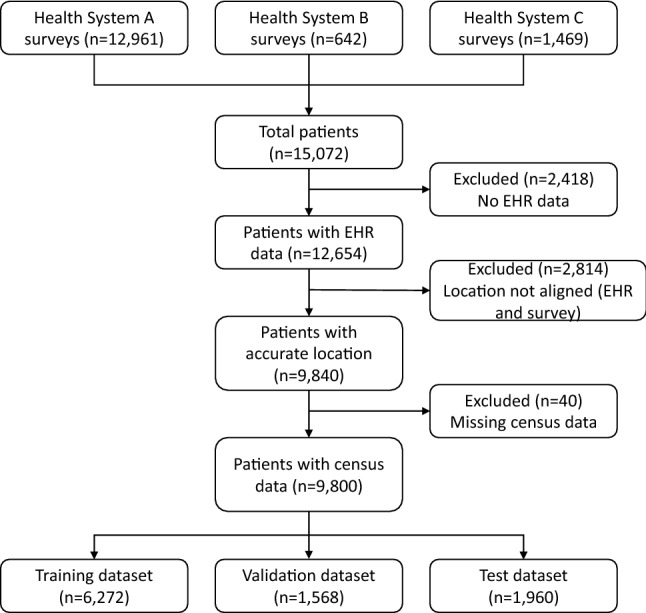
Figure 2.

Consort flow diagram. Consort flow diagram depicting the sample size at each step of the data linkage. The diagram moves downward with each step displayed as a rectangle. Patients were excluded from the final datasets if they had no EHR data, if there was not alignment with the EHR and survey addresses, and if their geocoded location was missing corresponding Census data. These exclusions are depicted as rectangles with arrows along the diagram indicating where a patient sample was excluded. From these exclusions, the bottom and final three rectangles depict the training, validation, and test datasets included in the data analysis.
